

Question: 2012 Pro Forma Balance Sheets Under Level Production (in thousands of dollars) Actual Dec 31, 2011 Jan Cash Accounts receivable Inventory Current assets Net
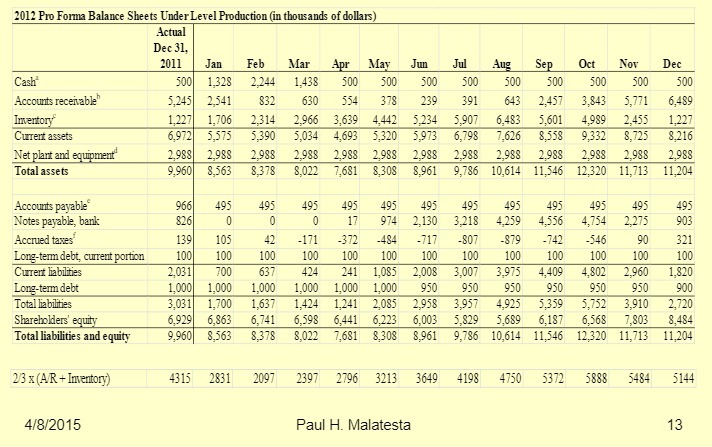
2012 Pro Forma Balance Sheets Under Level Production (in thousands of dollars) Actual Dec 31, 2011 Jan Cash Accounts receivable Inventory Current assets Net plant and equipment Total assets Feb Mar 500 1,328 2,244 1,438 5,245 2,541 832 1,227 1,706 2,314 6,972 5,575 5,390 2,988 2,988 2,988 9,960 8,563 8,378 Apr May Jun Jul Aug Sep Oct Nov Dec 500 500 500 500 500 500 500 500 500 630 554 378 2,966 3,639 4,442 5,234 5,907 5,034 4,693 5,320 5,973 6,798 7,626 8,558 2,988 2,988 2,988 2,988 2,988 2,988 2,988 8,022 7,681 8,308 8,961 9,786 10,614 11,546 239 391 643 2,457 3,843 5,771 6,489 6,483 5,601 4,989 2,455 1,227 9,332 8,725 8,216 2,988 2,988 2,988 12,320 11,713 11,204 Accounts payable 966 495 495 495 495 495 495 495 495 495 495 495 495 Notes payable, bank 826 0 0 0 17 974 2,130 3,218 4,259 4,556 4,754 2,275 903 Accrued taxes 139 105 42 -171 -372 -484 -717 -807 -879 -742 -546 90 321 Long-term debt, current portion 100 100 100 100 100 100 100 100 100 100 100 100 100 Current liabilities 2,031 700 637 424 241 1,085 2,008 3,007 3,975 4,409 4,802 2,960 1,820 Long-term debt 1,000 1,000 1,000 1,000 1,000 1,000 950 950 950 950 950 950 900 Total liabilities Shareholders' equity Total liabilities and equity 3,031 1,700 1,637 6,929 6,863 6,741 9,960 8,563 8,378 1,424 1,241 2,085 2,958 3,957 4,925 5,359 5,752 3,910 2,720 6,598 6,441 6,223 8,022 7,681 8,308 6,003 5,829 5,689 6,187 6,568 7,803 8,484 8,961 9,786 10,614 11,546 12,320 11,713 11,204 2/3 x (A/R+ Inventory) 4315 2831 2097 2397 2796 3213 3649 4198 4750 5372 5888 5484 5144 4/8/2015 Paul H. Malatesta 13
Step by Step Solution
There are 3 Steps involved in it

Get step-by-step solutions from verified subject matter experts