

Question: 2014-2018 Financial Statement Data and Stock Price Data for Mydeco Corp. (All data as of fiscal year end; in $ millions) Income Statement 2014 2015
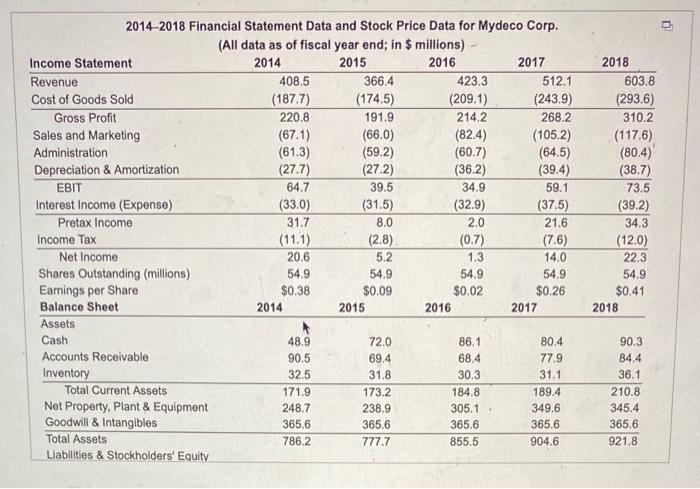
2014-2018 Financial Statement Data and Stock Price Data for Mydeco Corp. (All data as of fiscal year end; in $ millions) Income Statement 2014 2015 2016 2017 Revenue 408.5 366.4 423.3 512.1 Cost of Goods Sold (1877) (174.5) (209.1) (243.9) Gross Profit 220.8 191.9 214.2 268.2 Sales and Marketing (67.1) (66.0) (824) (105.2) Administration (61.3) (59.2) (60.7) (64.5) Depreciation & Amortization (277) (272) (36.2) (39.4) EBIT 64.7 39.5 34.9 59.1 Interest Income (Expense) (33.0) (31.5) (32.9) (37.5) Pretax Income 31.7 8.0 2.0 21.6 Income Tax (11.1) (2.8) (0.7) (7.6) Net Income 20.6 5.2 1.3 14.0 Shares Outstanding (millions) 54.9 54.9 54.9 54.9 Earnings per Share $0.38 $0.09 $0.02 $0.26 Balance Sheet 2014 2015 2016 2017 Assets Cash 48.9 72.0 86.1 80,4 Accounts Receivable 90.5 69.4 68.4 77.9 Inventory 32.5 31.8 30.3 31.1 Total Current Assets 171.9 173.2 184.8 189.4 Net Property, Plant & Equipment 248.7 238.9 305.1 349.6 Goodwill & Intangibles 365.6 365.6 365.6 365.6 Total Assets 786.2 777.7 855.5 904.6 Liabilities & Stockholders' Equity 2018 603.8 (293.6) 310.2 (117.6) (80.4) (38.7) 73.5 (39.2) 34.3 (120) 22.3 54.9 $0.41 2018 90.3 84.4 36.1 210.8 345.4 365.6 921.8 Consider the financial statement data and stock price data for Mydeco Corp. Click the icon to view the financial statement and stock price data. a. By what percentage did Mydeco's revenues grow each year from 2015 to 2018? b. By what percentage did net income grow each year? c. Why might the growth rates of revenues and net income differ? a. By what percentage did Mydeco's revenues grow each year from 2015 to 2018? The revenues growth for year 2015 is %. (Round to two decimal places.)
Step by Step Solution
There are 3 Steps involved in it

Get step-by-step solutions from verified subject matter experts