

Question: 2017 2018 2019 2020 Using the data below only, answer the following questions. Show your work. Long-term Data: E(R) Standard Deviation Portfolio D -25%
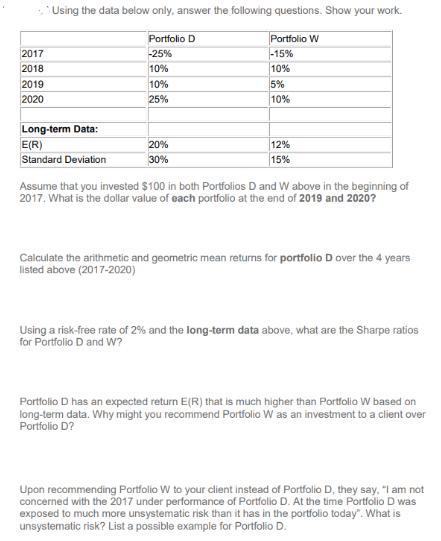
2017 2018 2019 2020 Using the data below only, answer the following questions. Show your work. Long-term Data: E(R) Standard Deviation Portfolio D -25% 10% 10% 25% 20% 30% Portfolio W -15% 10% 5% 10% 12% 15% Assume that you invested $100 in both Portfolios D and W above in the beginning of 2017. What is the dollar value of each portfolio at the end of 2019 and 2020? Calculate the arithmetic and geometric mean returns for portfolio D over the 4 years listed above (2017-2020) Using a risk-free rate of 2% and the long-term data above, what are the Sharpe ratios for Portfolio D and W? Portfolio D has an expected return E(R) that is much higher than Portfolio W based on long-term data. Why might you recommend Portfolio W as an investment to a client over Portfolio D? Upon recommending Portfolio W to your client instead of Portfolio D, they say, "I am not concerned with the 2017 under performance of Portfolio D. At the time Portfolio D was exposed to much more unsystematic risk than it has in the portfolio today". What is unsystematic risk? List a possible example for Portfolio D.
Step by Step Solution
3.49 Rating (159 Votes )
There are 3 Steps involved in it
To calculate the dollar value of each portfolio at the end of 2019 and 2020 we can use the following ... View full answer

Get step-by-step solutions from verified subject matter experts