

Question: 2017 Liquidity Ratio Method Current Ratio Current Assets/Current Liabilities Quick Ratio (Current Assets - Inventory) Current Liabilities 0.82 2018 2019 2020 2021 0.76 1.893557 1.6400389
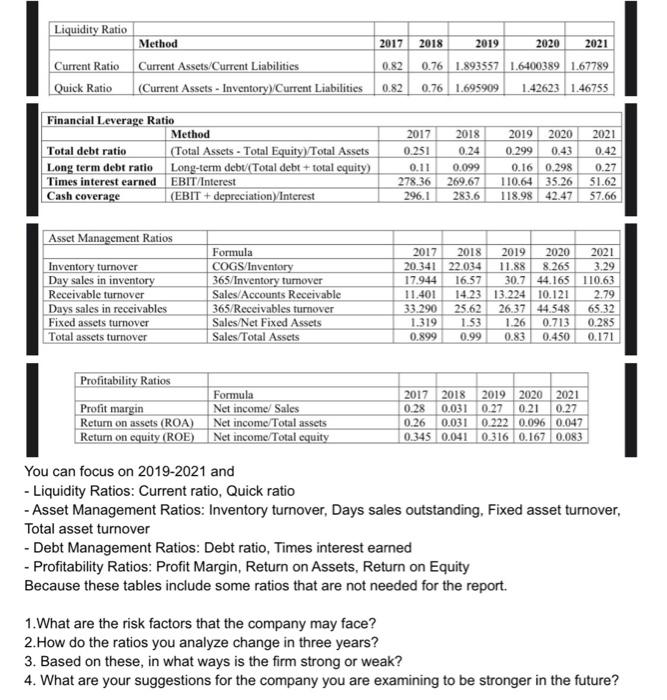
2017 Liquidity Ratio Method Current Ratio Current Assets/Current Liabilities Quick Ratio (Current Assets - Inventory) Current Liabilities 0.82 2018 2019 2020 2021 0.76 1.893557 1.6400389 1.67789 0.76 1.695909 1.42623 1.46755 0.82 Financial Leverage Ratio Method Total debt ratio (Total Assets - Total Equity) Total Assets Long term debt ratio Long-term debt/(Total debt + total equity) Times interest earned EBIT/Interest Cash coverage (EBIT + depreciation) Interest 2017 0.251 0.11 278.36 296.1 2018 0.24 0.099 269.67 283.6 2019 2020 0.299 0.43 0.16 0.298 110.64 35.26 118.98 42.47 2021 0.42 0.27 51.62 57.66 Asset Management Ratios Inventory turnover Day sales in inventory Receivable turnover Days sales in receivables Fixed assets turnover Total assets turnover Formula COGS/Inventory 365/Inventory turnover Sales/Accounts Receivable 365/Receivables turnover Sales/Net Fixed Assets Sales Total Assets 2017 2018 2019 2020 2021 20.341 22.034 11.88 8.265 3.29 17.944 16.57 30.7 44.165 110.63 11.401 14.23 13.224 10.121 2.79 33.290 25.62 26.3744.548 65.32 1.319 1.53 1.26 0.713 0.285 0.899 0.99 0.83 0.450 0.171 Profitability Ratios Profit margin Return on assets (ROA) Return on equity (ROE) Formula Net income Sales Net income/Total assets Net income/Total equity 2017 2018 2019 2020 2021 0.28 0.031 0.27 0.21 0.27 0.26 0.031 0.222 0.096 0.047 0.345 0.041 0.316 0.167 0.083 You can focus on 2019-2021 and - Liquidity Ratios: Current ratio, Quick ratio - Asset Management Ratios: Inventory turnover, Days sales outstanding, Fixed asset turnover, Total asset turnover - Debt Management Ratios: Debt ratio, Times interest earned - Profitability Ratios: Profit Margin, Return on Assets, Return on Equity Because these tables include some ratios that are not needed for the report. 1. What are the risk factors that the company may face? 2. How do the ratios you analyze change in three years? 3. Based on these, in what ways is the firm strong or weak? 4. What are your suggestions for the company you are examining to be stronger in the future
Step by Step Solution
There are 3 Steps involved in it

Get step-by-step solutions from verified subject matter experts