

Question: 2019 $ $ $ $ $ 52,000 402,000 836,000 1,290,000 527,000 166,200 360,800 1,650,800 Income Statements Sales Cost of goods sold Other expenses Depreciation Total
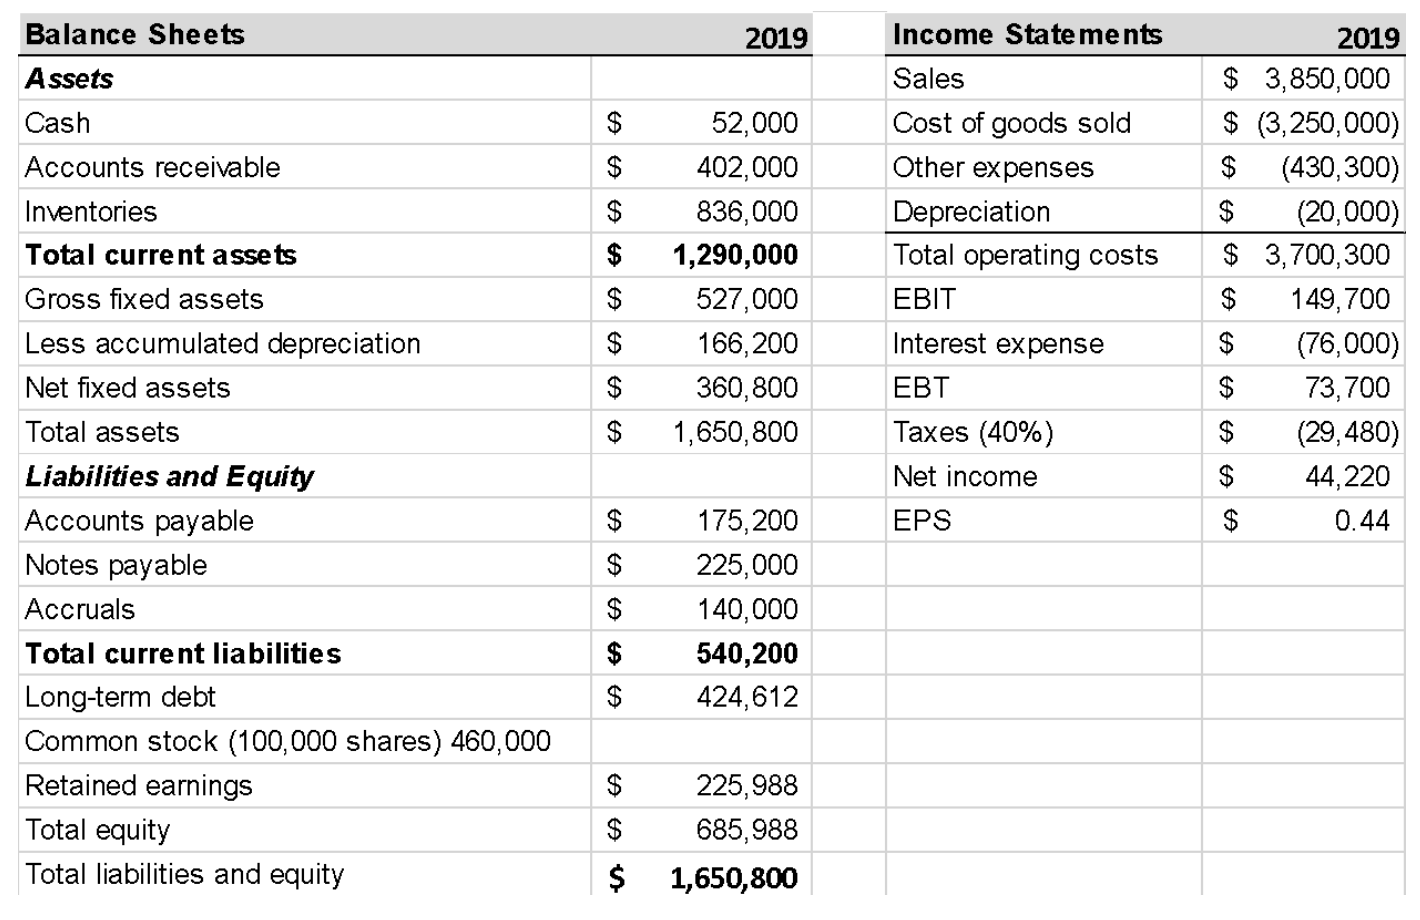
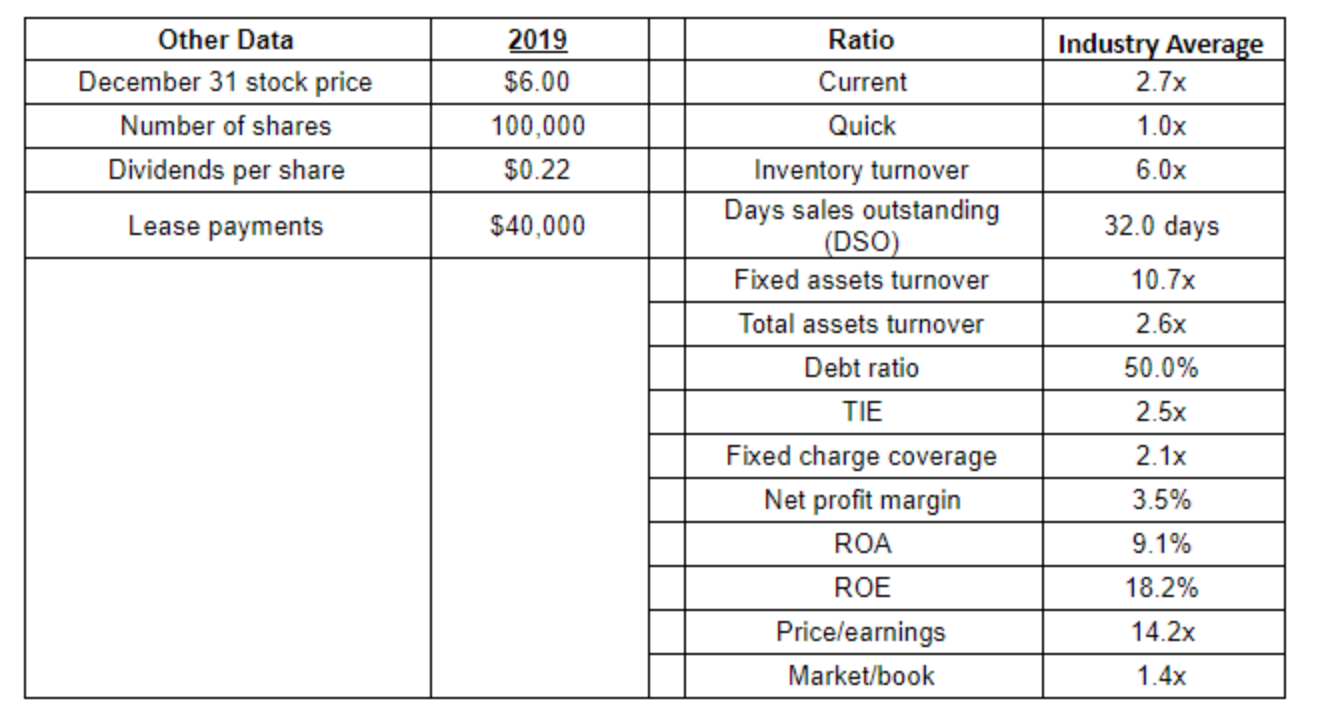
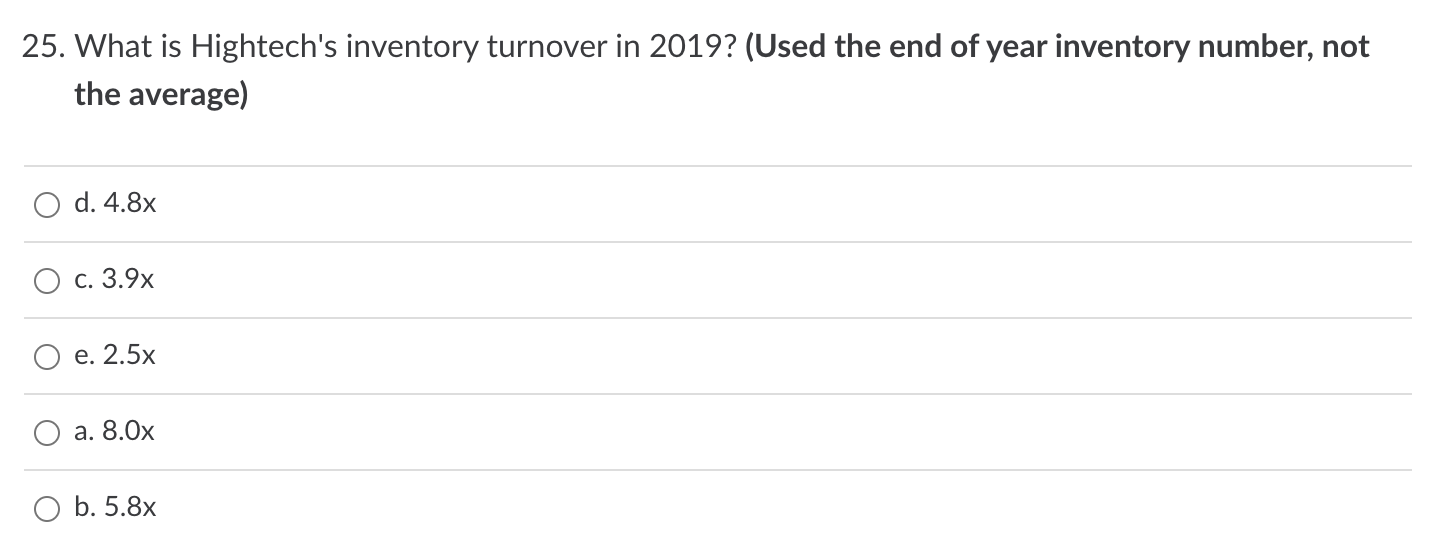
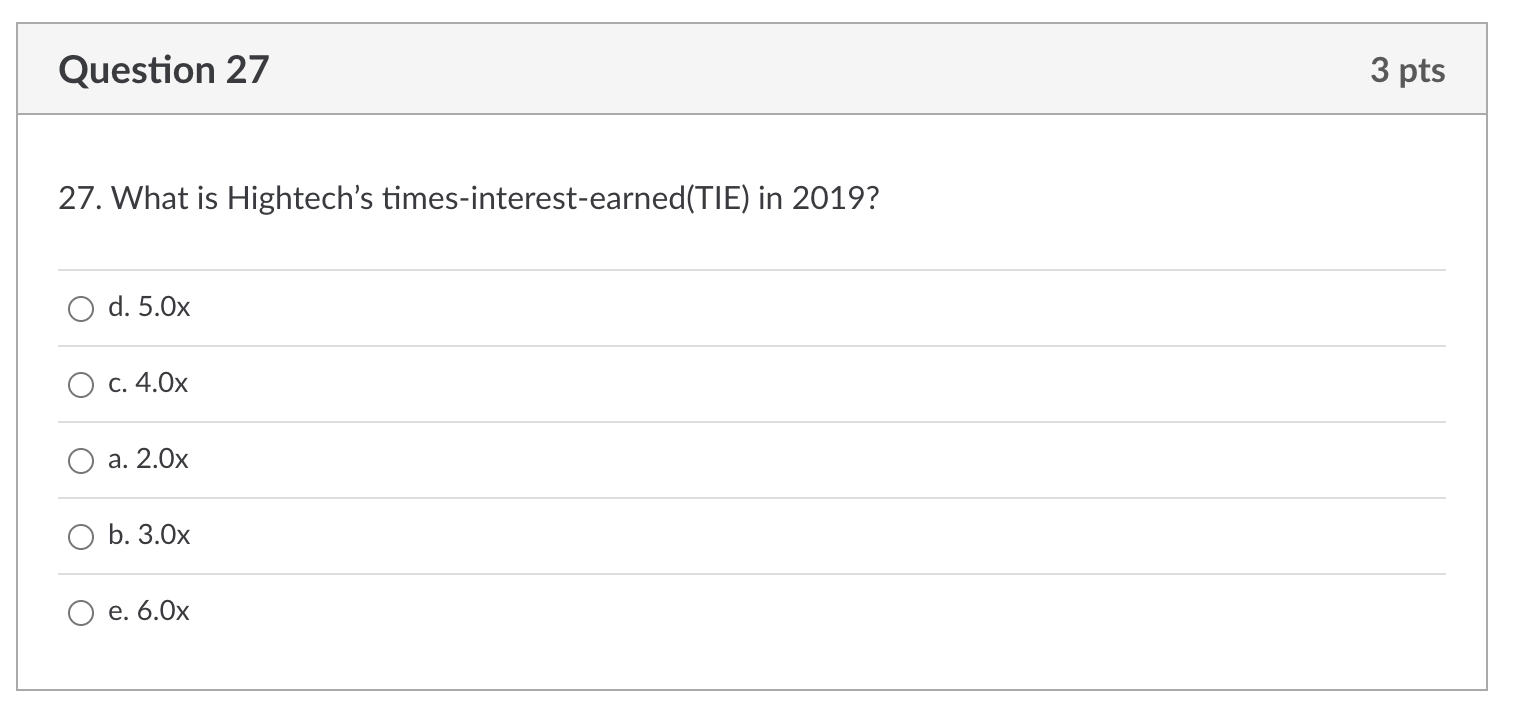
2019 $ $ $ $ $ 52,000 402,000 836,000 1,290,000 527,000 166,200 360,800 1,650,800 Income Statements Sales Cost of goods sold Other expenses Depreciation Total operating costs EBIT Interest expense EBT Taxes (40%) Net income EPS Balance Sheets Assets Cash Accounts receivable Inventories Total current assets Gross fixed assets Less accumulated depreciation Net fixed assets Total assets Liabilities and Equity Accounts payable Notes payable Accruals Total current liabilities Long-term debt Common stock (100,000 shares) 460,000 Retained earnings Total equity Total liabilities and equity 2019 $ 3,850,000 $ (3,250,000) $ (430,300) $ (20,000) $ 3,700,300 149,700 $ (76,000) $ 73,700 $ (29,480) $ 44,220 $ 0.44 $ $ $ $ $ 175,200 225,000 140,000 540,200 424,612 $ $ $ $ 225,988 685,988 1,650,800 $ Other Data December 31 stock price Number of shares Dividends per share Lease payments 2019 $6.00 100,000 $0.22 Industry Average 2.7x 1.0x 6.0x $40,000 32.0 days Ratio Current Quick Inventory turnover Days sales outstanding (DSO) Fixed assets turnover Total assets turnover Debt ratio TIE Fixed charge coverage Net profit margin ROA ROE Pricelearnings Market/book 10.7x 2.6x 50.0% 2.5x 2.1x 3.5% 9.1% 18.2% 14.2x 1.4x 25. What is Hightech's inventory turnover in 2019? (Used the end of year inventory number, not the average) d. 4.8x c. 3.9x e. 2.5x a. 8.0x O b. 5.8x Question 27 3 pts 27. What is Hightech's times-interest-earned(TIE) in 2019? O d. 5.Ox C. 4.Ox a. 2.Ox O O b. 3.0x e. 6.Ox
Step by Step Solution
There are 3 Steps involved in it

Get step-by-step solutions from verified subject matter experts