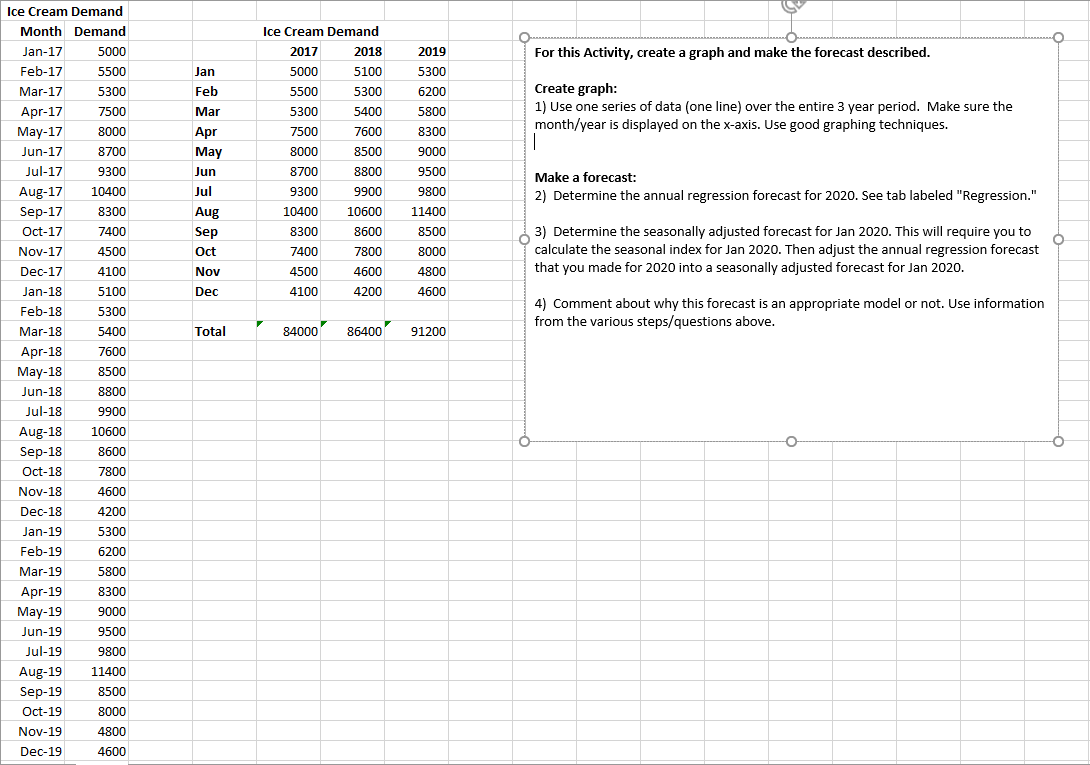
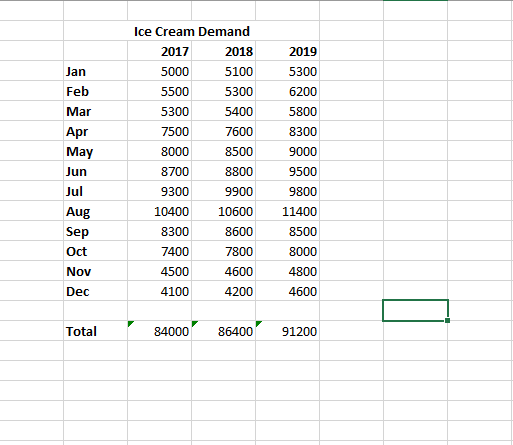
Question: 2019 5300 For this Activity, create a graph and make the forecast described. Jan Feb Mar Ice Cream Demand 2017 2018 5000 5100 5500 5300

2019 5300 For this Activity, create a graph and2019 5300 For this Activity, create a graph and2019 5300 For this Activity, create a graph and

2019 5300 For this Activity, create a graph and make the forecast described. Jan Feb Mar Ice Cream Demand 2017 2018 5000 5100 5500 5300 5300 5400 7500 7600 8000 8500 8700 8800 9300 9900 Create graph: 1) Use one series of data (one line) over the entire 3 year period. Make sure the month/year is displayed on the x-axis. Use good graphing techniques. Apr May Jun 6200 5800 8300 9000 9500 9800 11400 8500 Jul Make a forecast: 2) Determine the annual regression forecast for 2020. See tab labeled "Regression." 10400 10600 8300 8600 Ice Cream Demand Month Demand Jan-17 5000 Feb-17 5500 Mar-17 5300 Apr-17 7500 May-17 8000 Jun-17 8700 Jul-17 9300 Aug-17 10400 Sep-17 8300 Oct-17 7400 Nov-17 4500 Dec-17 4100 Jan-18 5100 Feb-18 5300 Mar-18 5400 Apr-18 7600 May-18 8500 Jun-18 8800 Jul-18 9900 Aug-18 10600 Sep-18 8600 Oct-18 7800 Nov-18 4600 Aug Sep Oct Dec 7400 7800 8000 3) Determine the seasonally adjusted forecast for Jan 2020. This will require you to calculate the seasonal index for Jan 2020. Then adjust the annual regression forecast that you made for 2020 into a seasonally adjusted forecast for Jan 2020. 4500 4600 4800 4600 4100 4200 4) Comment about why this forecast is an appropriate model or not. Use information from the various steps/questions above. Total 84000 86400 91200 -O Dec-18 4200 5300 Jan-19 Feb-19 6200 Mar-19 5800 8300 9000 9500 Apr-19 May-19 Jun-19 Jul-19 Aug-19 Sep-19 Oct-19 9800 11400 8500 8000 4800 Nov-19 Dec-19 4600 Ice Cream Demand Regression Year Demand Forecast 2017 84000 2018 86400 2019 91200 2020 slope intercept Jan Feb Mar Apr May Jun Jul Aug Sep Oct Ice Cream Demand 2017 2018 5000 5100 5500 5300 5300 5400 7500 7600 8000 8500 8700 8800 9300 9900 10400 10600 8300 8600 7400 7800 2019 5300 6200 5800 8300 9000 9500 9800 11400 8500 8000 4600 Nov Dec 4500 4100 4800 4600 4200 Total 84000 86400 91200

Step by Step Solution

There are 3 Steps involved in it

1 Expert Approved Answer
Step: 1 Unlock blur-text-image
Question Has Been Solved by an Expert!

Get step-by-step solutions from verified subject matter experts

Step: 2 Unlock
Step: 3 Unlock

Students Have Also Explored These Related General Management Questions!