

Question: 202 Chapter 9 . Correlation and Simple Regression TABLE 9.1 Sample Size and Power as a Function of the Population Correlation Coefficient, for Alpha =
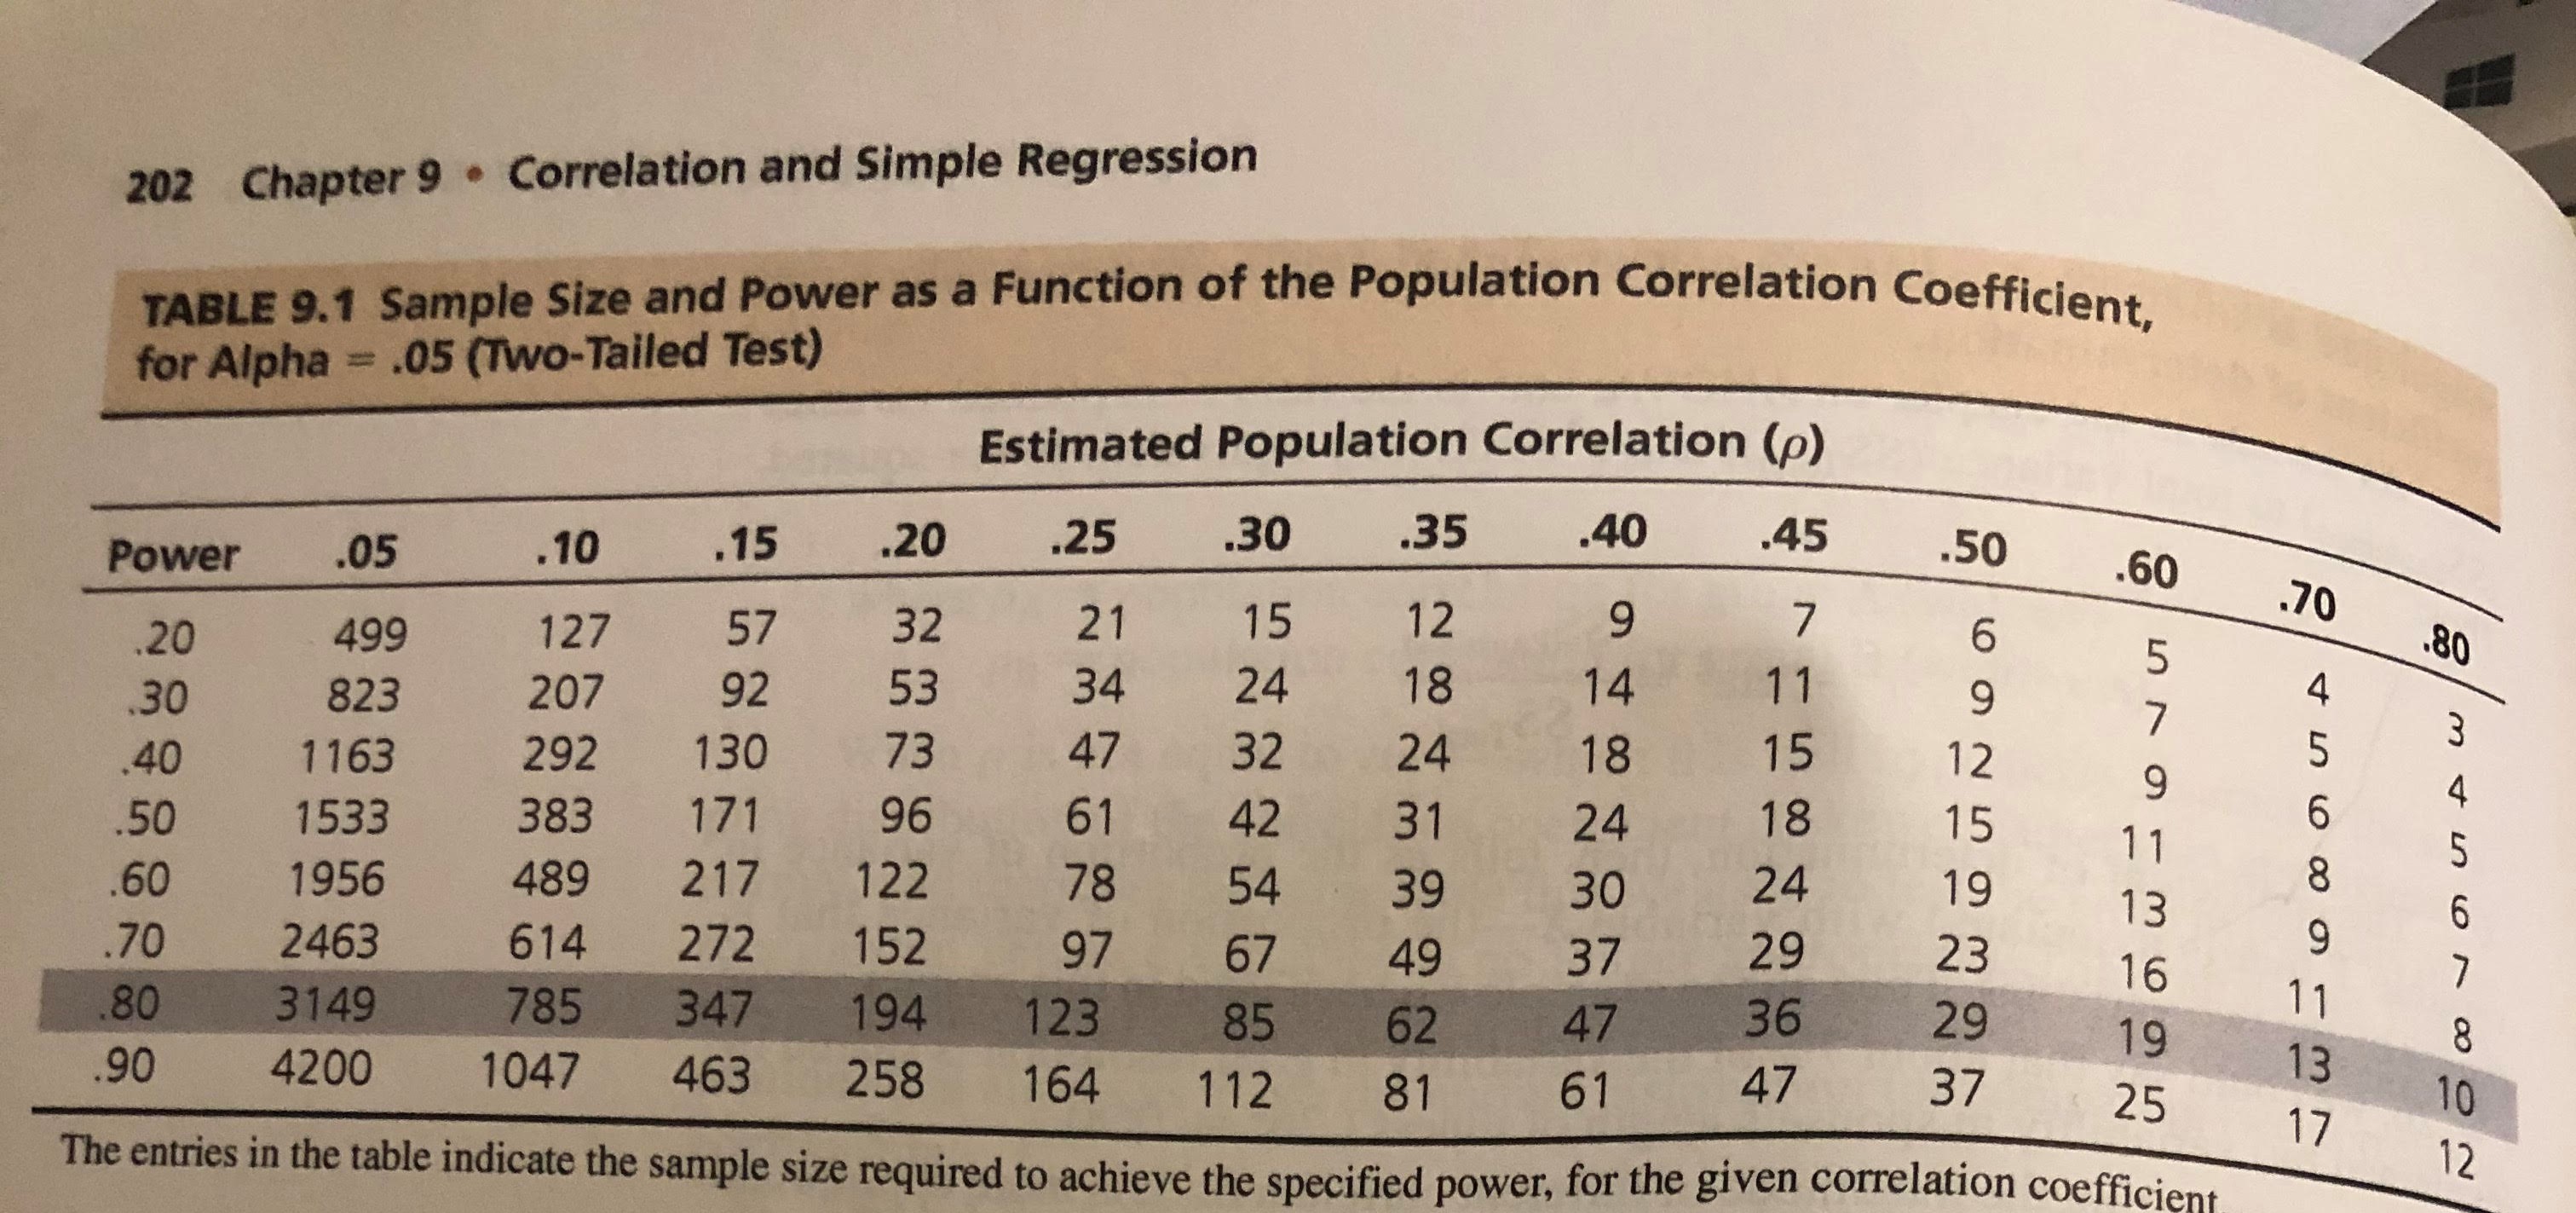
202 Chapter 9 . Correlation and Simple Regression TABLE 9.1 Sample Size and Power as a Function of the Population Correlation Coefficient, for Alpha = .05 (Two-Tailed Test) Estimated Population Correlation (p) . 10 .15 .20 .25 .30 .35 .40 .45 Power .05 .50 .60 70 20 499 127 57 32 21 15 12 9 7 6 .80 .30 823 207 92 53 34 24 18 14 11 9 140 1163 292 130 73 47 32 24 18 15 12 9 50 1533 383 171 96 61 42 31 24 18 15 10 00 0) UTA 11 60 1956 489 217 122 78 54 39 30 24 19 13 DCO VOUT A W 70 2463 614 272 152 97 67 49 37 29 23 16 80 3149 785 347 194 123 85 62 47 36 29 11 19 90 4200 1047 463 258 112 61 47 37 13 164 81 25 17 The entries in the table indicate the sample size required to achieve the specified power, for the given correlation coefficient 12
Step by Step Solution
There are 3 Steps involved in it

Get step-by-step solutions from verified subject matter experts