

Question: 2020 2018 please answer all the questions using the statements provide. please show all the necessary calculations you can think of.. ASSIGNMENT QUESTIONS NB: All
2020


2018


please answer all the questions using the statements provide. please show all the necessary calculations you can think of..
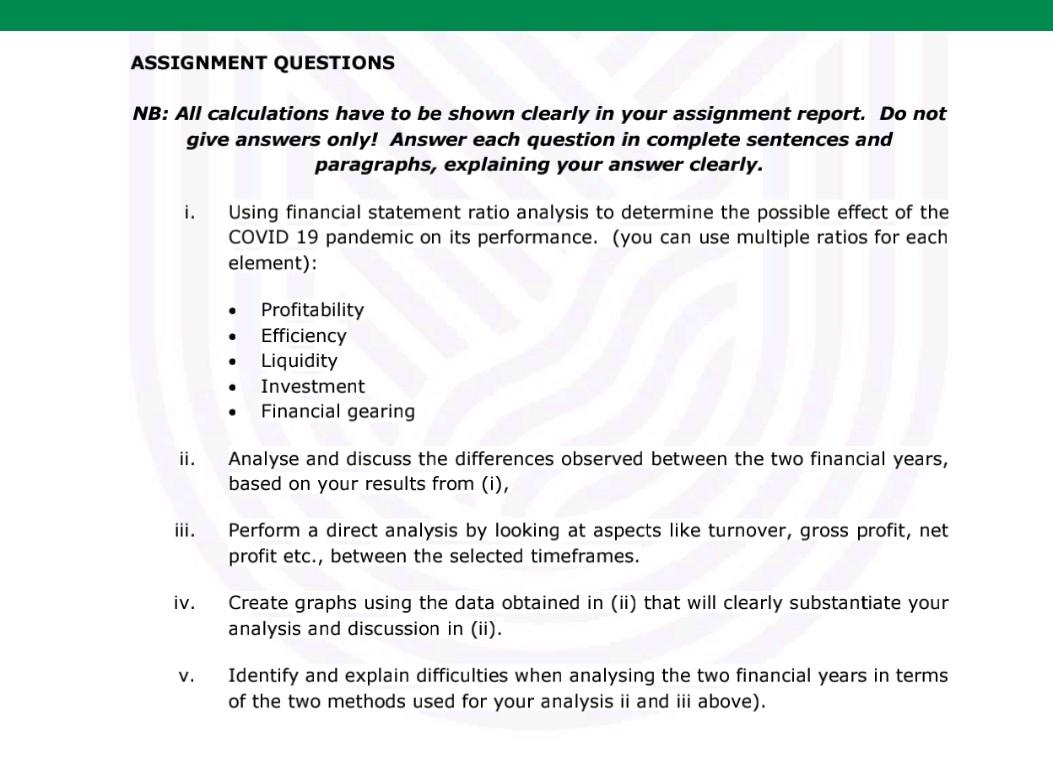
ASSIGNMENT QUESTIONS NB: All calculations have to be shown clearly in your assignment report. Do not give answers only! Answer each question in complete sentences and paragraphs, explaining your answer clearly. i. Using financial statement ratio analysis to determine the possible effect of the COVID 19 pandemic on its performance. (you can use multiple ratios for each element): . Profitability Efficiency . Liquidity Investment Financial gearing ii. Analyse and discuss the differences observed between the two financial years, based on your results from (i), iii. Perform a direct analysis by looking at aspects like turnover, gross profit, net profit etc., between the selected timeframes. iv. Create graphs using the data obtained in (ii) that will clearly substantiate your analysis and discussion in (ii). V. Identify and explain difficulties when analysing the two financial years in terms of the two methods used for your analysis ii and iii above). ASSIGNMENT QUESTIONS NB: All calculations have to be shown clearly in your assignment report. Do not give answers only! Answer each question in complete sentences and paragraphs, explaining your answer clearly. i. Using financial statement ratio analysis to determine the possible effect of the COVID 19 pandemic on its performance. (you can use multiple ratios for each element): . Profitability Efficiency . Liquidity Investment Financial gearing ii. Analyse and discuss the differences observed between the two financial years, based on your results from (i), iii. Perform a direct analysis by looking at aspects like turnover, gross profit, net profit etc., between the selected timeframes. iv. Create graphs using the data obtained in (ii) that will clearly substantiate your analysis and discussion in (ii). V. Identify and explain difficulties when analysing the two financial years in terms of the two methods used for your analysis ii and iii above). ASSIGNMENT QUESTIONS NB: All calculations have to be shown clearly in your assignment report. Do not give answers only! Answer each question in complete sentences and paragraphs, explaining your answer clearly. i. Using financial statement ratio analysis to determine the possible effect of the COVID 19 pandemic on its performance. (you can use multiple ratios for each element): . Profitability Efficiency . Liquidity Investment Financial gearing ii. Analyse and discuss the differences observed between the two financial years, based on your results from (i), iii. Perform a direct analysis by looking at aspects like turnover, gross profit, net profit etc., between the selected timeframes. iv. Create graphs using the data obtained in (ii) that will clearly substantiate your analysis and discussion in (ii). V. Identify and explain difficulties when analysing the two financial years in terms of the two methods used for your analysis ii and iii above). ASSIGNMENT QUESTIONS NB: All calculations have to be shown clearly in your assignment report. Do not give answers only! Answer each question in complete sentences and paragraphs, explaining your answer clearly. i. Using financial statement ratio analysis to determine the possible effect of the COVID 19 pandemic on its performance. (you can use multiple ratios for each element): . Profitability Efficiency . Liquidity Investment Financial gearing ii. Analyse and discuss the differences observed between the two financial years, based on your results from (i), iii. Perform a direct analysis by looking at aspects like turnover, gross profit, net profit etc., between the selected timeframes. iv. Create graphs using the data obtained in (ii) that will clearly substantiate your analysis and discussion in (ii). V. Identify and explain difficulties when analysing the two financial years in terms of the two methods used for your analysis ii and iii above). ASSIGNMENT QUESTIONS NB: All calculations have to be shown clearly in your assignment report. Do not give answers only! Answer each question in complete sentences and paragraphs, explaining your answer clearly. i. Using financial statement ratio analysis to determine the possible effect of the COVID 19 pandemic on its performance. (you can use multiple ratios for each element): . Profitability Efficiency . Liquidity Investment Financial gearing ii. Analyse and discuss the differences observed between the two financial years, based on your results from (i), iii. Perform a direct analysis by looking at aspects like turnover, gross profit, net profit etc., between the selected timeframes. iv. Create graphs using the data obtained in (ii) that will clearly substantiate your analysis and discussion in (ii). V. Identify and explain difficulties when analysing the two financial years in terms of the two methods used for your analysis ii and iii above). ASSIGNMENT QUESTIONS NB: All calculations have to be shown clearly in your assignment report. Do not give answers only! Answer each question in complete sentences and paragraphs, explaining your answer clearly. i. Using financial statement ratio analysis to determine the possible effect of the COVID 19 pandemic on its performance. (you can use multiple ratios for each element): . Profitability Efficiency . Liquidity Investment Financial gearing ii. Analyse and discuss the differences observed between the two financial years, based on your results from (i), iii. Perform a direct analysis by looking at aspects like turnover, gross profit, net profit etc., between the selected timeframes. iv. Create graphs using the data obtained in (ii) that will clearly substantiate your analysis and discussion in (ii). V. Identify and explain difficulties when analysing the two financial years in terms of the two methods used for your analysis ii and iii above). ASSIGNMENT QUESTIONS NB: All calculations have to be shown clearly in your assignment report. Do not give answers only! Answer each question in complete sentences and paragraphs, explaining your answer clearly. i. Using financial statement ratio analysis to determine the possible effect of the COVID 19 pandemic on its performance. (you can use multiple ratios for each element): . Profitability Efficiency . Liquidity Investment Financial gearing ii. Analyse and discuss the differences observed between the two financial years, based on your results from (i), iii. Perform a direct analysis by looking at aspects like turnover, gross profit, net profit etc., between the selected timeframes. iv. Create graphs using the data obtained in (ii) that will clearly substantiate your analysis and discussion in (ii). V. Identify and explain difficulties when analysing the two financial years in terms of the two methods used for your analysis ii and iii above). ASSIGNMENT QUESTIONS NB: All calculations have to be shown clearly in your assignment report. Do not give answers only! Answer each question in complete sentences and paragraphs, explaining your answer clearly. i. Using financial statement ratio analysis to determine the possible effect of the COVID 19 pandemic on its performance. (you can use multiple ratios for each element): . Profitability Efficiency . Liquidity Investment Financial gearing ii. Analyse and discuss the differences observed between the two financial years, based on your results from (i), iii. Perform a direct analysis by looking at aspects like turnover, gross profit, net profit etc., between the selected timeframes. iv. Create graphs using the data obtained in (ii) that will clearly substantiate your analysis and discussion in (ii). V. Identify and explain difficulties when analysing the two financial years in terms of the two methods used for your analysis ii and iii above). ASSIGNMENT QUESTIONS NB: All calculations have to be shown clearly in your assignment report. Do not give answers only! Answer each question in complete sentences and paragraphs, explaining your answer clearly. i. Using financial statement ratio analysis to determine the possible effect of the COVID 19 pandemic on its performance. (you can use multiple ratios for each element): . Profitability Efficiency . Liquidity Investment Financial gearing ii. Analyse and discuss the differences observed between the two financial years, based on your results from (i), iii. Perform a direct analysis by looking at aspects like turnover, gross profit, net profit etc., between the selected timeframes. iv. Create graphs using the data obtained in (ii) that will clearly substantiate your analysis and discussion in (ii). V. Identify and explain difficulties when analysing the two financial years in terms of the two methods used for your analysis ii and iii above). ASSIGNMENT QUESTIONS NB: All calculations have to be shown clearly in your assignment report. Do not give answers only! Answer each question in complete sentences and paragraphs, explaining your answer clearly. i. Using financial statement ratio analysis to determine the possible effect of the COVID 19 pandemic on its performance. (you can use multiple ratios for each element): . Profitability Efficiency . Liquidity Investment Financial gearing ii. Analyse and discuss the differences observed between the two financial years, based on your results from (i), iii. Perform a direct analysis by looking at aspects like turnover, gross profit, net profit etc., between the selected timeframes. iv. Create graphs using the data obtained in (ii) that will clearly substantiate your analysis and discussion in (ii). V. Identify and explain difficulties when analysing the two financial years in terms of the two methods used for your analysis ii and iii above)
Step by Step Solution
There are 3 Steps involved in it

Get step-by-step solutions from verified subject matter experts