

Question: 2021 2020 please do a 2 year cross section analysis graph like below and findings/analysis for the 4 ratios of Beacon Pharma no handwritten please.
2021 2020

please do a 2 year cross section analysis graph like below and findings/analysis for the 4 ratios of Beacon Pharma
no handwritten please.
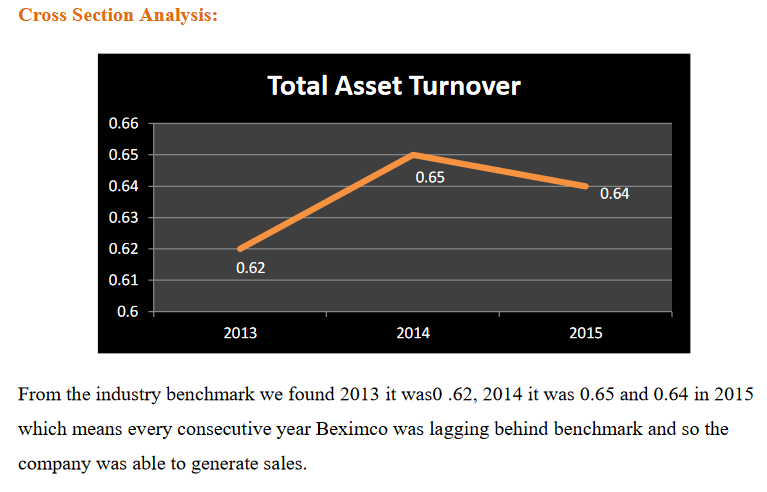
EPS Number of Shares Used to Compute EPS Price Per Share Price Earning Ratio 3.73666361 231000000 23.18 6.203394904 1.648014515 231000000 20.04 12.16008707 Cross Section Analysis: Total Asset Turnover 0.66 0.65 0.65 0.64 0.64 0.63 0.62 0.62 0.61 0.6 2013 2014 2015 From the industry benchmark we found 2013 it was0.62, 2014 it was 0.65 and 0.64 in 2015 which means every consecutive year Beximco was lagging behind benchmark and so the company was able to generate sales
Step by Step Solution
There are 3 Steps involved in it
1 Expert Approved Answer
Step: 1 Unlock

Question Has Been Solved by an Expert!
Get step-by-step solutions from verified subject matter experts
Step: 2 Unlock
Step: 3 Unlock