

Question: 2021_SUMM_HAD_521_400_940 X C X Homework Help - Q&A from Onlin X New Week 6 Excel Assignment H X + Office Editing for Docs, Sheets
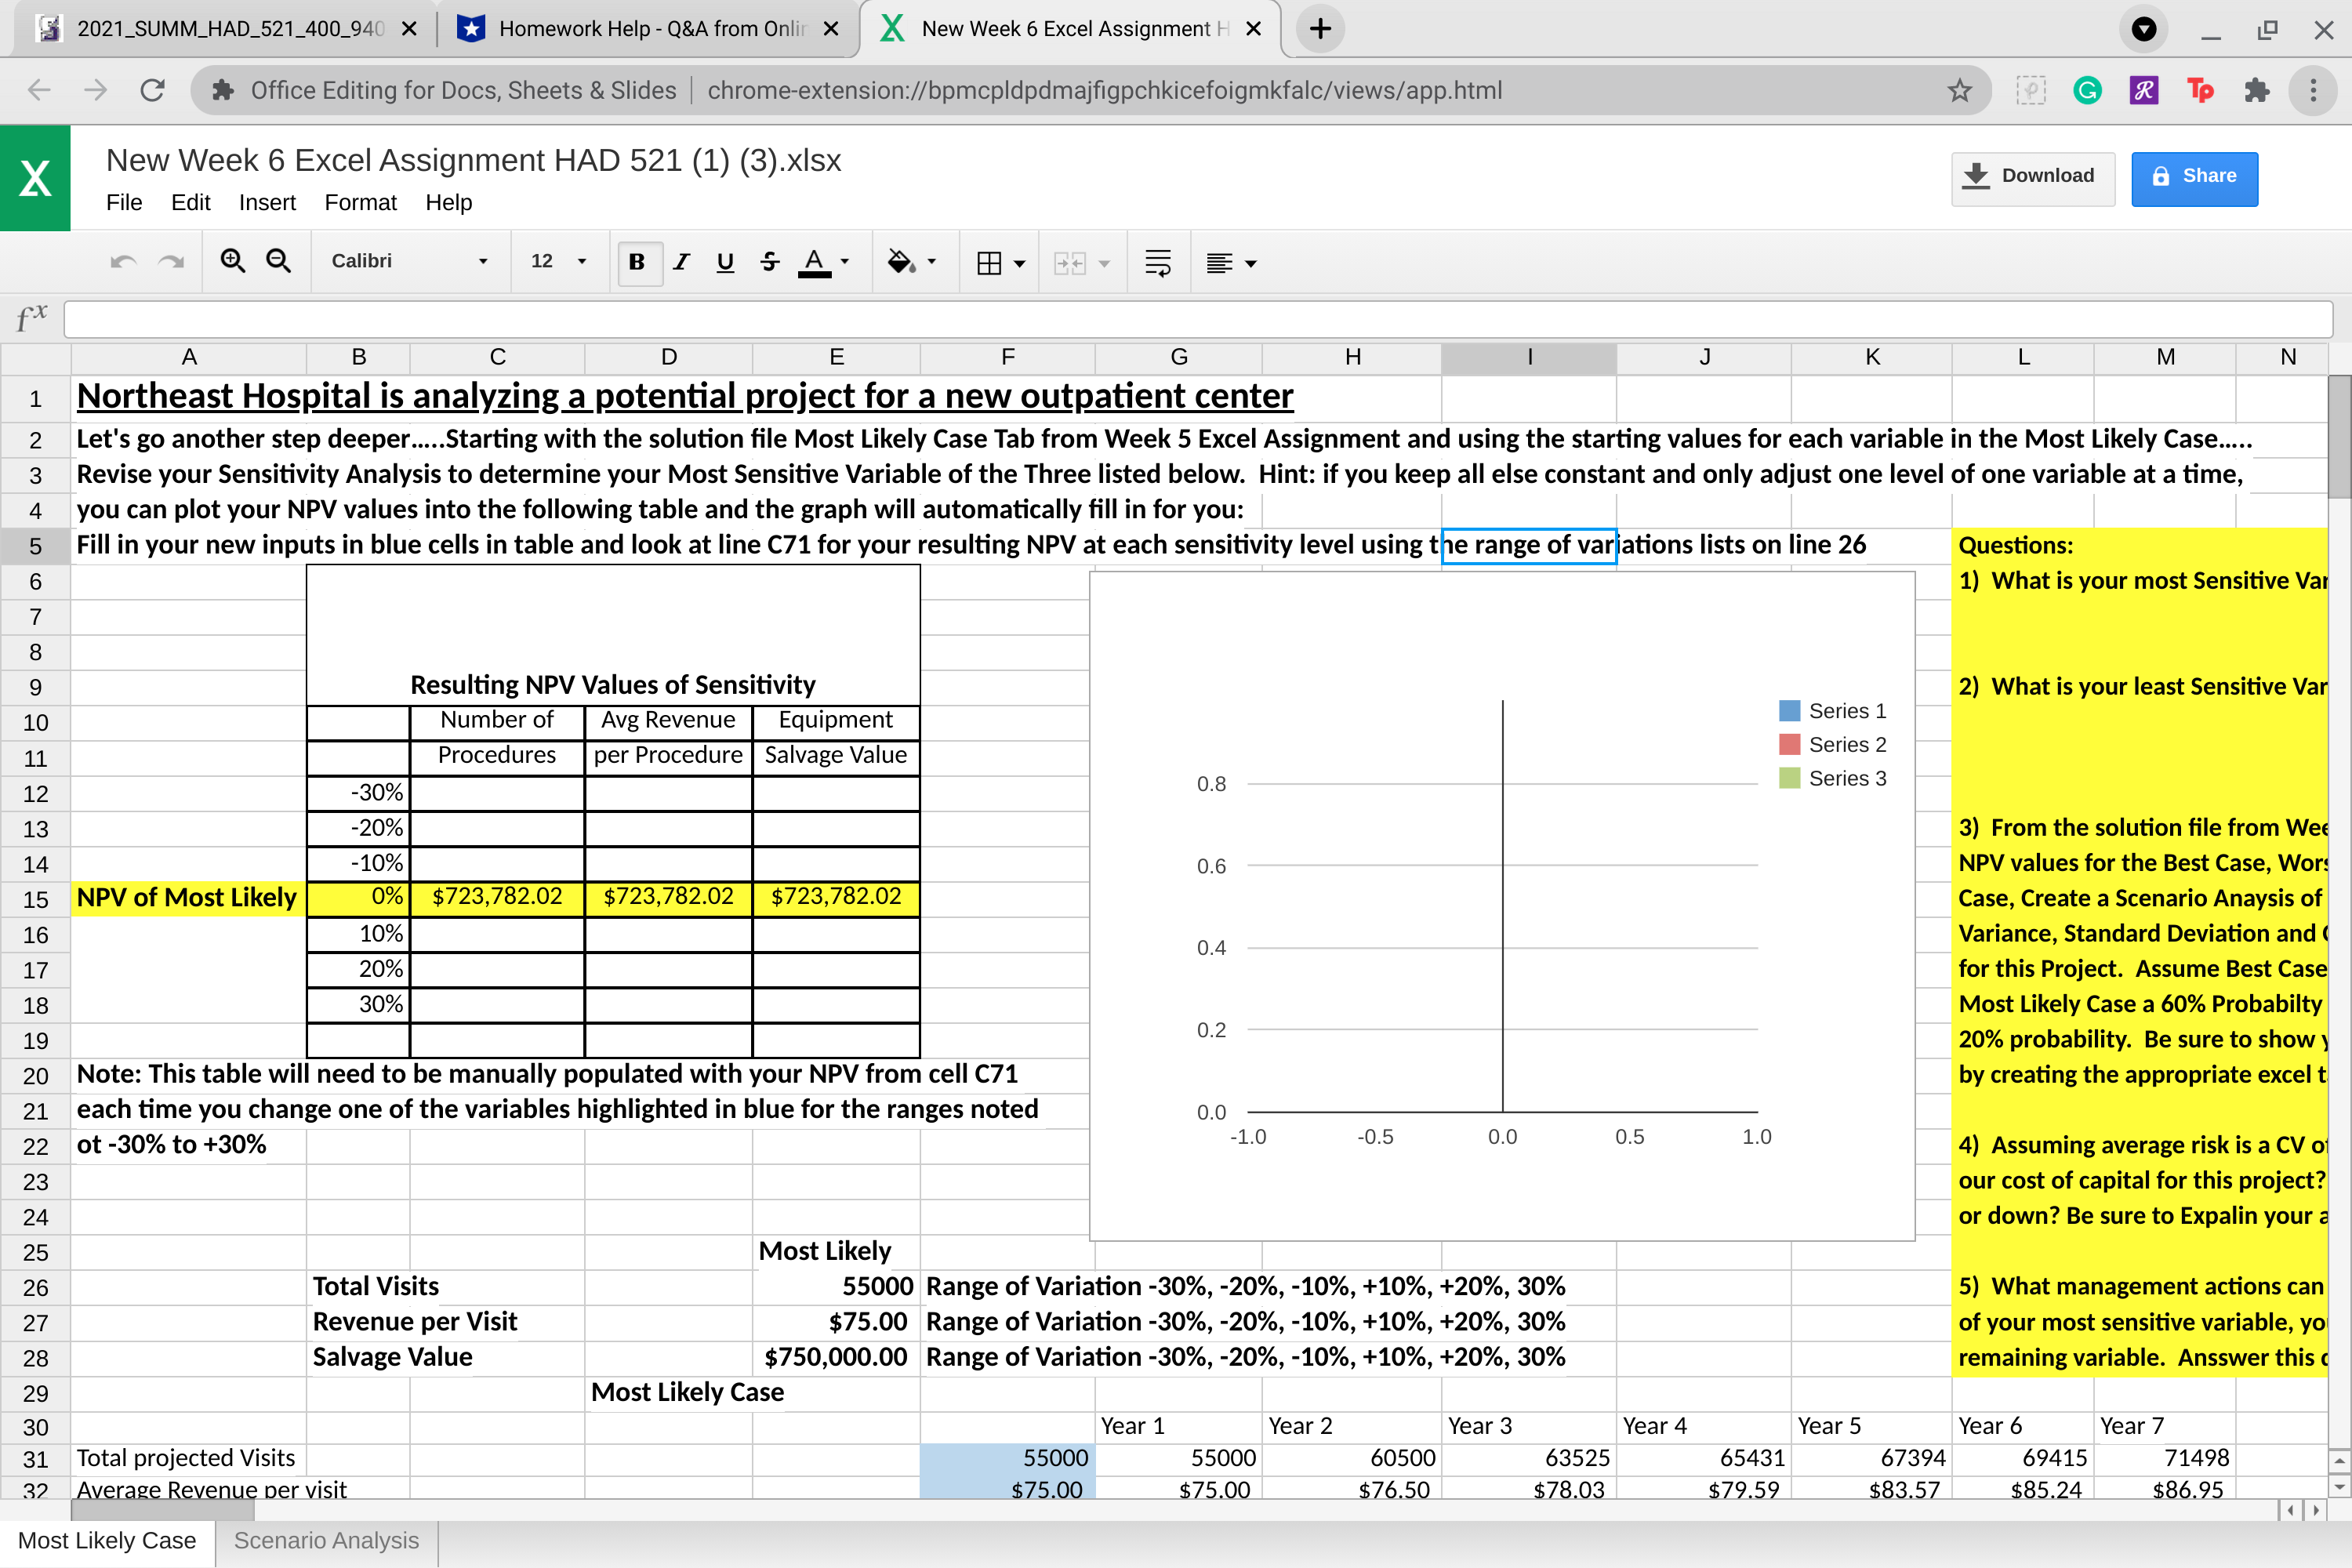
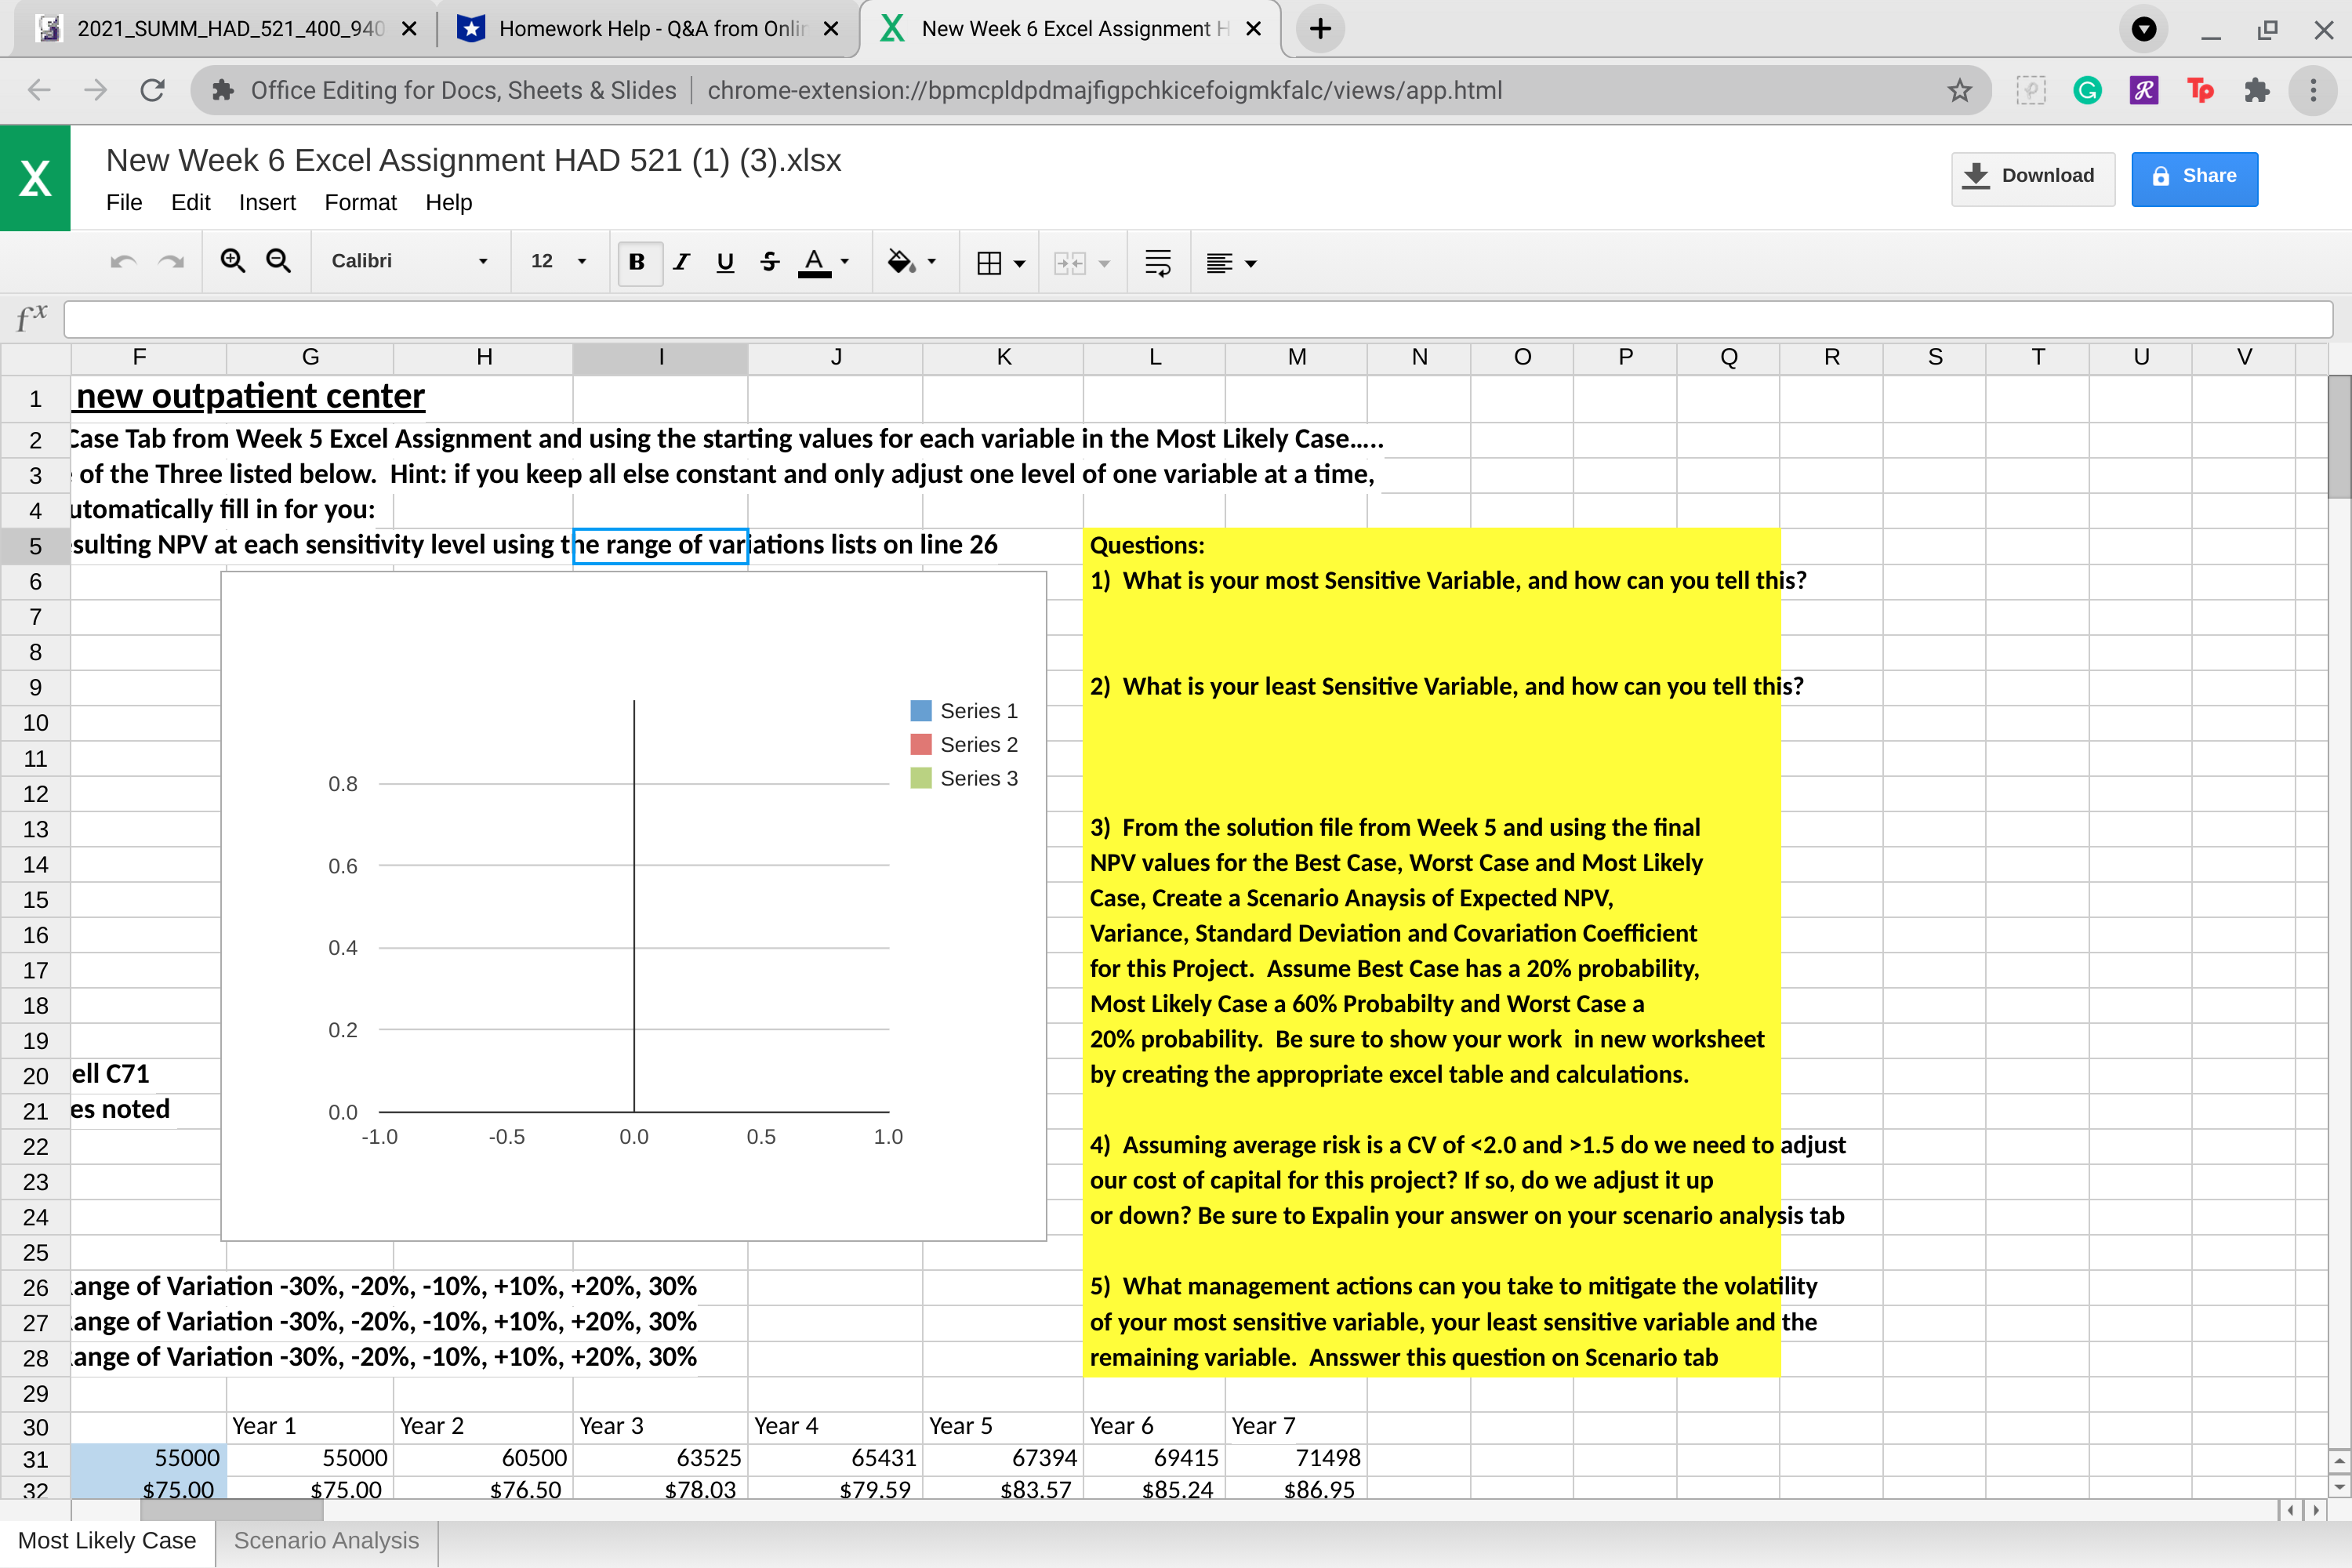
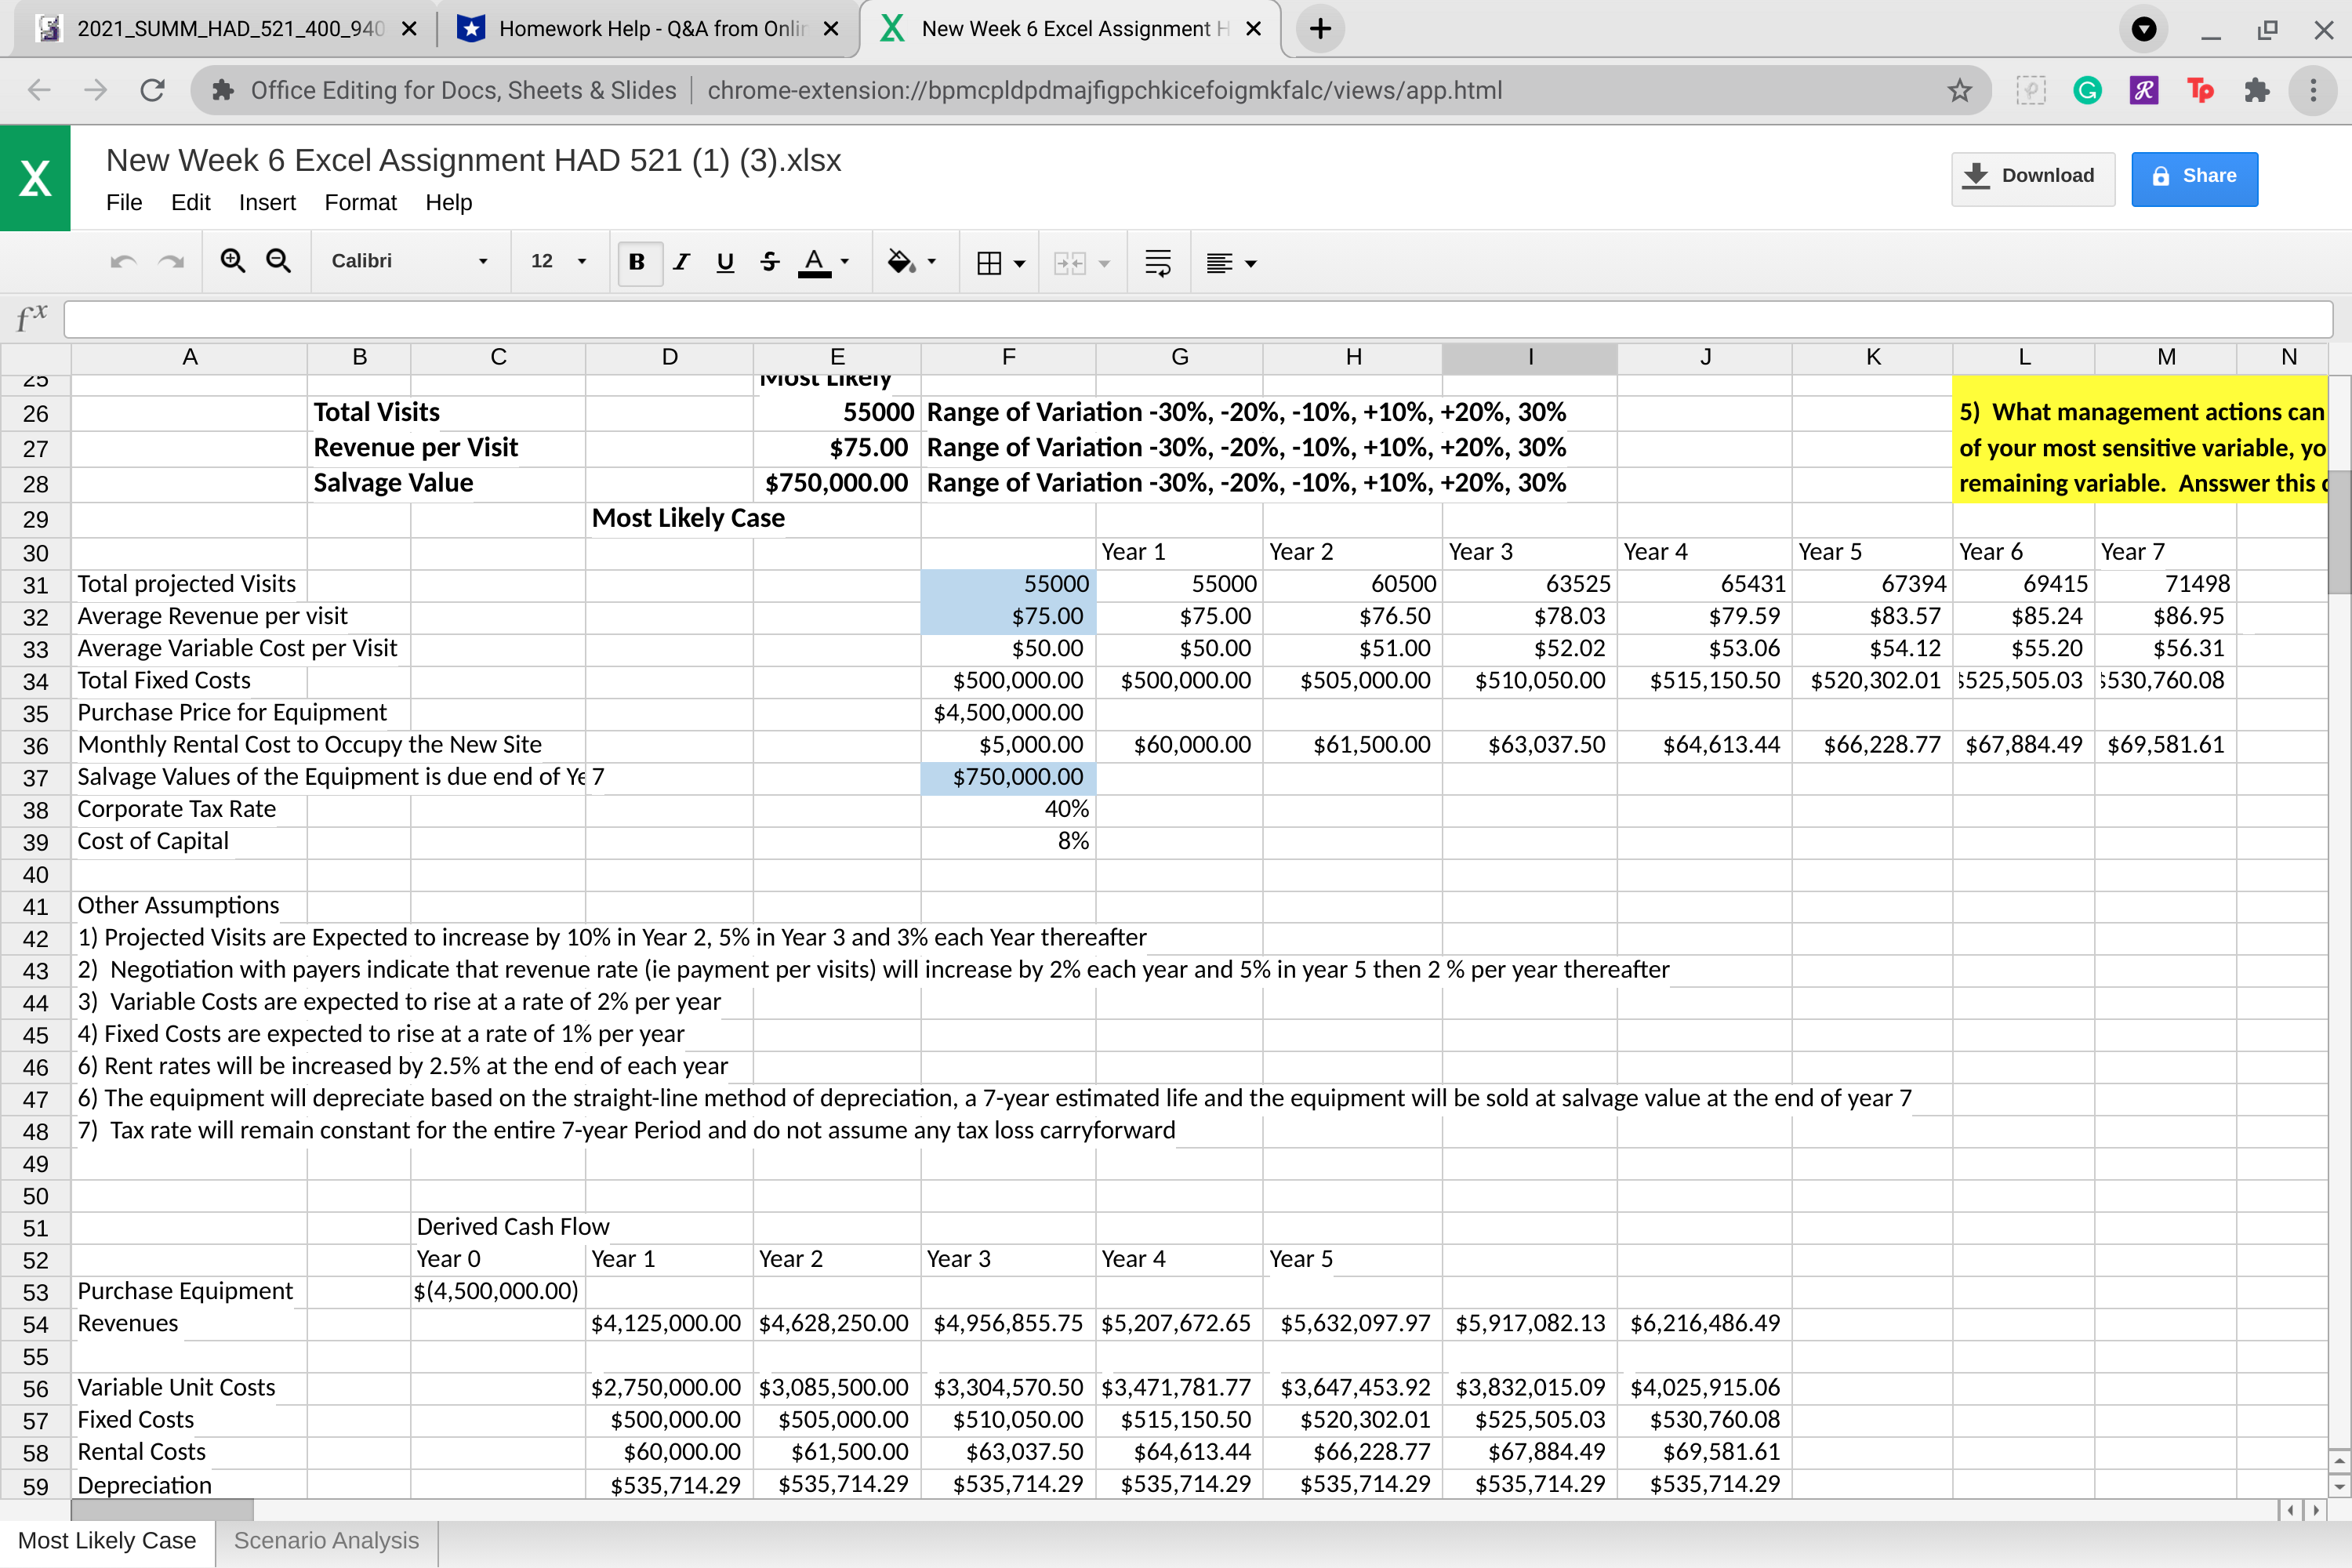
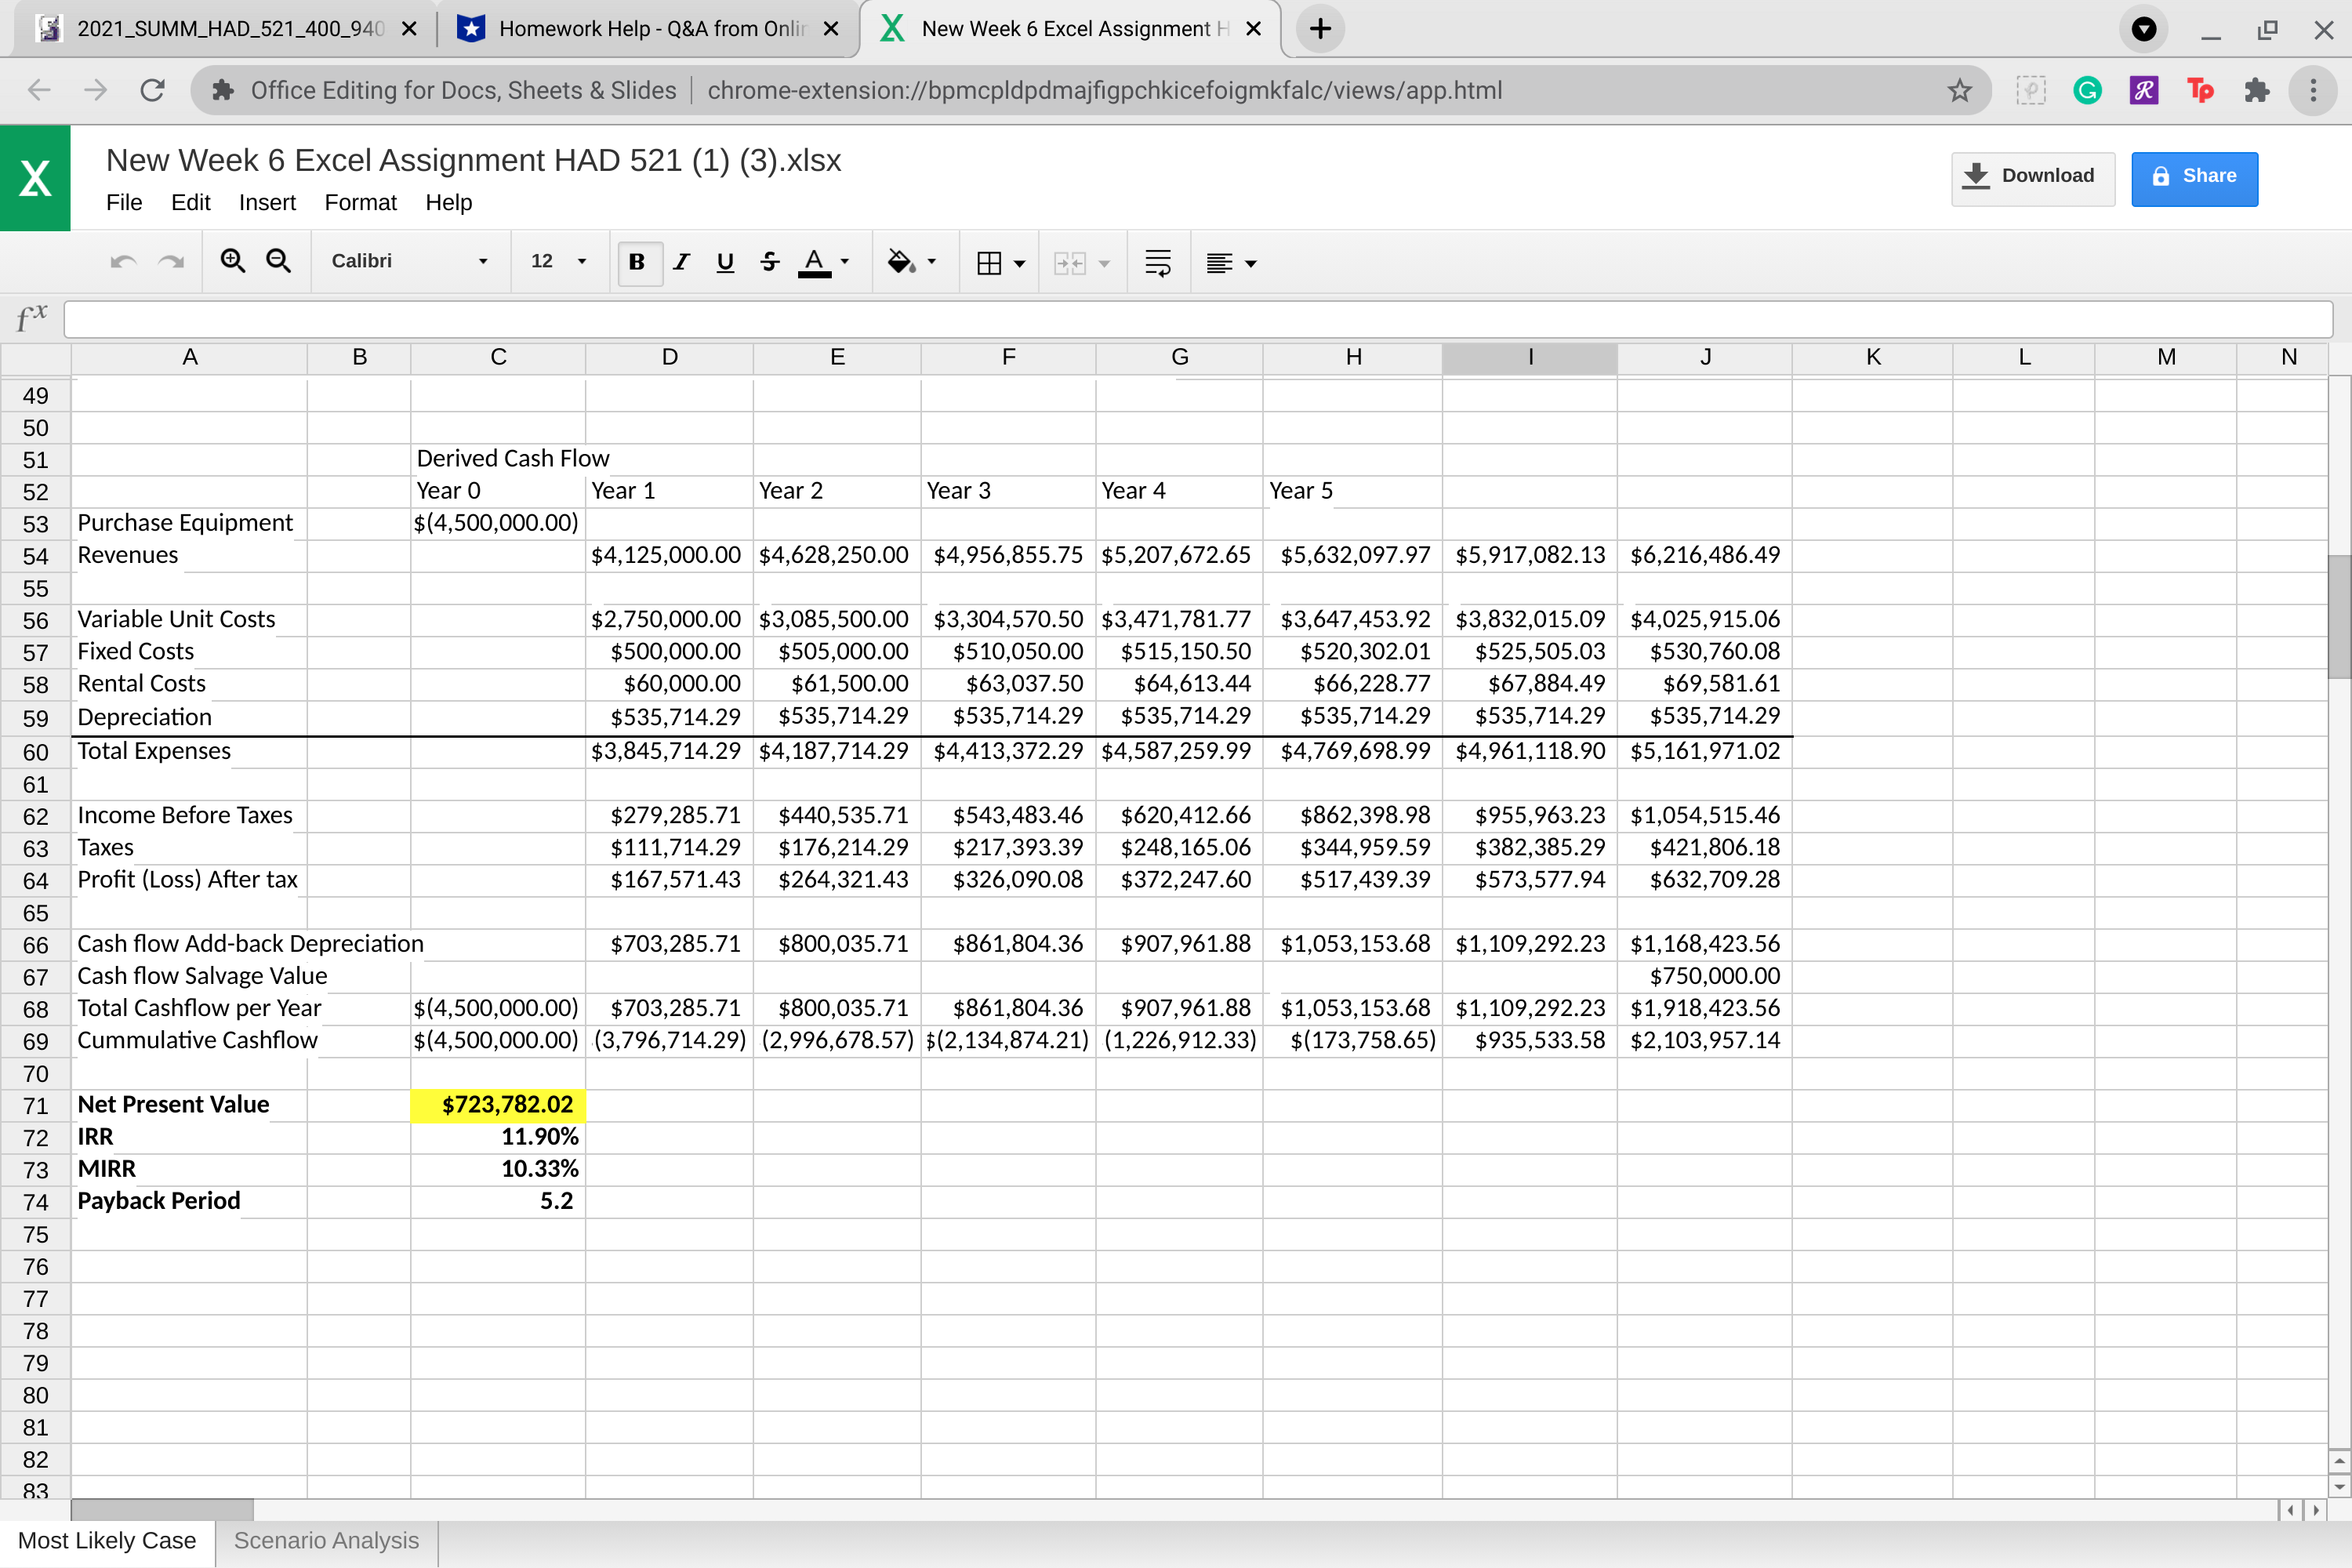
2021_SUMM_HAD_521_400_940 X C X Homework Help - Q&A from Onlin X New Week 6 Excel Assignment H X + Office Editing for Docs, Sheets & Slides | chrome-extension://bpmcpldpdmajfigpchkicefoigmkfalc/views/app.html New Week 6 Excel Assignment HAD 521 (1) (3).xlsx File Edit Insert Format Help fx A Q Q Calibri B C 12 B I USA E F G H R Tp Download 8 Share J K L M N 1 23 Northeast Hospital is analyzing a potential project for a new outpatient center Let's go another step deeper.....Starting with the solution file Most Likely Case Tab from Week 5 Excel Assignment and using the starting values for each variable in the Most Likely Case..... Revise your Sensitivity Analysis to determine your Most Sensitive Variable of the Three listed below. Hint: if you keep all else constant and only adjust one level of one variable at a time, 4 you can plot your NPV values into the following table and the graph will automatically fill in for you: Questions: X 5 Fill in your new inputs in blue cells in table and look at line C71 for your resulting NPV at each sensitivity level using the range of variations lists on line 26 6 1) What is your most Sensitive Var 7 8 9 10 Resulting NPV Values of Sensitivity Number of Avg Revenue 11 Procedures 12 -30% Equipment per Procedure Salvage Value 0.8 2) What is your least Sensitive Var Series 1 Series 2 Series 3 13 -20% 14 -10% 0.6 15 NPV of Most Likely 0% $723,782.02 $723,782.02 $723,782.02 16 10% 0.4 17 20% 18 30% 0.2 19 20 21 22 Note: This table will need to be manually populated with your NPV from cell C71 each time you change one of the variables highlighted in blue for the ranges noted ot -30% to +30% 0.0 -1.0 -0.5 0.0 0.5 1.0 23 24 25 Most Likely 26 Total Visits 27 28 29 Revenue per Visit Salvage Value Most Likely Case 55000 Range of Variation -30%, -20%, -10%, +10%, +20%, 30% $75.00 Range of Variation -30%, -20%, -10%, +10%, +20%, 30% $750,000.00 Range of Variation -30%, -20%, -10%, +10%, +20%, 30% 3) From the solution file from Wee NPV values for the Best Case, Wors Case, Create a Scenario Anaysis of Variance, Standard Deviation and for this Project. Assume Best Case Most Likely Case a 60% Probabilty 20% probability. Be sure to show y by creating the appropriate excel t 4) Assuming average risk is a CV of our cost of capital for this project? or down? Be sure to Expalin your a 5) What management actions can of your most sensitive variable, yo remaining variable. Ansswer this 30 31 Total projected Visits 32 Average Revenue per visit Most Likely Case Scenario Analysis Year 1 Year 2 Year 3 Year 4 Year 5 Year 6 Year 7 55000 $75.00 55000 $75.00 60500 $76.50 63525 $78.03 65431 $79.59 67394 $83.57 69415 $85.24 71498 $86.95 2021_SUMM_HAD_521_400_940 X C X Homework Help - Q&A from Onlin X New Week 6 Excel Assignment H X + Office Editing for Docs, Sheets & Slides | chrome-extension://bpmcpldpdmajfigpchkicefoigmkfalc/views/app.html New Week 6 Excel Assignment HAD 521 (1) (3).xlsx File Edit Insert Format Help Q Q Calibri 12 B I USA JII fx F G H J K L M N P Q R 1 new outpatient center 3 2 Case Tab from Week 5 Excel Assignment and using the starting values for each variable in the Most Likely Case..... of the Three listed below. Hint: if you keep all else constant and only adjust one level of one variable at a time, 4 utomatically fill in for you: 5 sulting NPV at each sensitivity level using the range of variations lists on line 26 Questions: 1) What is your most Sensitive Variable, and how can you tell this? 6 7 8 9 10 11 0.8 12 13 14 0.6 15 16 0.4 17 18 0.2 19 20 ell C71 21 es noted 0.0 -1.0 -0.5 0.0 0.5 1.0 22 23 24 25 26 ange of Variation -30%, -20%, -10%, +10%, +20%, 30% 27 ange of Variation -30%, -20%, -10%, +10%, +20%, 30% 28 ange of Variation -30%, -20%, -10%, +10%, +20%, 30% 2) What is your least Sensitive Variable, and how can you tell this? Series 1 Series 2 Series 3 3) From the solution file from Week 5 and using the final NPV values for the Best Case, Worst Case and Most Likely Case, Create a Scenario Anaysis of Expected NPV, Variance, Standard Deviation and Covariation Coefficient for this Project. Assume Best Case has a 20% probability, Most Likely Case a 60% Probabilty and Worst Case a 20% probability. Be sure to show your work in new worksheet by creating the appropriate excel table and calculations. 4) Assuming average risk is a CV of 1.5 do we need to adjust our cost of capital for this project? If so, do we adjust it up or down? Be sure to Expalin your answer on your scenario analysis tab 5) What management actions can you take to mitigate the volatility of your most sensitive variable, your least sensitive variable and the remaining variable. Ansswer this question on Scenario tab 29 30 Year 1 Year 2 Year 3 Year 4 Year 5 Year 6 Year 7 31 32 55000 $75.00 55000 $75.00 60500 $76.50 63525 $78.03 65431 $79.59 67394 $83.57 69415 $85.24 71498 $86.95 Most Likely Case Scenario Analysis S R Tp Download 8 Share T U V X 2021_SUMM_HAD_521_400_940 X C X Homework Help - Q&A from Onlin X New Week 6 Excel Assignment H X + Office Editing for Docs, Sheets & Slides | chrome-extension://bpmcpldpdmajfigpchkicefoigmkfalc/views/app.html New Week 6 Excel Assignment HAD 521 (1) (3).xlsx File Edit Insert Format Help fx 25 26 27 28 29 30 31 Q Q Calibri A B Total Visits C 12 B I USA E IVOST LIKETY F G H 55000 Range of Variation -30%, -20%, -10%, +10%, +20%, 30% $75.00 Range of Variation -30%, -20%, -10%, +10%, +20%, 30% $750,000.00 Range of Variation -30%, -20%, -10%, +10%, +20%, 30% Revenue per Visit Salvage Value Most Likely Case Total projected Visits 32 Average Revenue per visit 33 34 35 Average Variable Cost per Visit Total Fixed Costs Purchase Price for Equipment 36 Monthly Rental Cost to Occupy the New Site K R Tp X Download 8 Share L M N 5) What management actions can of your most sensitive variable, yo remaining variable. Ansswer this Year 1 Year 2 Year 3 Year 4 Year 5 Year 6 Year 7 55000 55000 60500 63525 65431 67394 69415 71498 $75.00 $75.00 $76.50 $78.03 $79.59 $83.57 $85.24 $86.95 $50.00 $50.00 $51.00 $52.02 $53.06 $54.12 $55.20 $56.31 $500,000.00 $500,000.00 $505,000.00 $510,050.00 $515,150.50 $520,302.01 $525,505.03 $530,760.08 $4,500,000.00 $5,000.00 $750,000.00 $60,000.00 $61,500.00 $63,037.50 $64,613.44 $66,228.77 $67,884.49 $69,581.61 37 Salvage Values of the Equipment is due end of Ye 7 38 Corporate Tax Rate 40% 39 Cost of Capital 8% 40 41 Other Assumptions 42 1) Projected Visits are Expected to increase by 10% in Year 2, 5% in Year 3 and 3% each Year thereafter 43 2) Negotiation with payers indicate that revenue rate (ie payment per visits) will increase by 2% each year and 5% in year 5 then 2% per year thereafter 44 3) Variable Costs are expected to rise at a rate of 2% per year 45 4) Fixed Costs are expected to rise at a rate of 1% per year 46 6) Rent rates will be increased by 2.5% at the end of each year 47 6) The equipment will depreciate based on the straight-line method of depreciation, a 7-year estimated life and the equipment will be sold at salvage value at the end of year 7 48 7) Tax rate will remain constant for the entire 7-year Period and do not assume any tax loss carryforward 49 50 51 Derived Cash Flow 52 Year O Year 1 Year 2 Year 3 Year 4 Year 5 53 Purchase Equipment $(4,500,000.00) 54 Revenues $4,125,000.00 $4,628,250.00 $4,956,855.75 $5,207,672.65 $5,632,097.97 $5,917,082.13 $6,216,486.49 55 56 Variable Unit Costs 57 Fixed Costs 58 Rental Costs $2,750,000.00 $3,085,500.00 $500,000.00 $505,000.00 $60,000.00 59 Depreciation $535,714.29 $61,500.00 $535,714.29 $3,304,570.50 $3,471,781.77 $3,647,453.92 $3,832,015.09 $4,025,915.06 $510,050.00 $515,150.50 $520,302.01 $525,505.03 $530,760.08 $63,037.50 $64,613.44 $66,228.77 $67,884.49 $535,714.29 $535,714.29 $535,714.29 $535,714.29 $69,581.61 $535,714.29 Most Likely Case Scenario Analysis 2021_SUMM_HAD_521_400_940 X C X Homework Help - Q&A from Onlin X New Week 6 Excel Assignment H X + Office Editing for Docs, Sheets & Slides | chrome-extension://bpmcpldpdmajfigpchkicefoigmkfalc/views/app.html New Week 6 Excel Assignment HAD 521 (1) (3).xlsx File Edit Insert Format Help fx 49 Q Q Calibri A B C 12 B I USA E G H 50 51 52 53 Purchase Equipment Derived Cash Flow Year O $(4,500,000.00) Year 1 Year 2 Year 3 Year 4 Year 5 54 Revenues 55 56 Variable Unit Costs 57 Fixed Costs 58 Rental Costs 59 Depreciation 60 Total Expenses 61 62 Income Before Taxes 63 Taxes 64 Profit (Loss) After tax 65 66 Cash flow Add-back Depreciation 67 Cash flow Salvage Value 68 Total Cashflow per Year 69 Cummulative Cashflow $4,125,000.00 $4,628,250.00 $4,956,855.75 $5,207,672.65 $5,632,097.97 $5,917,082.13 $6,216,486.49 $2,750,000.00 $3,085,500.00 $500,000.00 $505,000.00 $60,000.00 $61,500.00 $535,714.29 $535,714.29 $3,845,714.29 $4,187,714.29 $3,304,570.50 $3,471,781.77 $3,647,453.92 $3,832,015.09 $4,025,915.06 $510,050.00 $515,150.50 $520,302.01 $525,505.03 $530,760.08 $63,037.50 $64,613.44 $66,228.77 $67,884.49 $69,581.61 $535,714.29 $535,714.29 $535,714.29 $535,714.29 $535,714.29 $4,413,372.29 $4,587,259.99 $4,769,698.99 $4,961,118.90 $5,161,971.02 $279,285.71 $440,535.71 $543,483.46 $620,412.66 $862,398.98 $955,963.23 $1,054,515.46 $111,714.29 $176,214.29 $217,393.39 $248,165.06 $344,959.59 $382,385.29 $421,806.18 $167,571.43 $264,321.43 $326,090.08 $372,247.60 $517,439.39 $573,577.94 $632,709.28 $703,285.71 $800,035.71 $861,804.36 $907,961.88 $1,053,153.68 $1,109,292.23 $1,168,423.56 $750,000.00 $(4,500,000.00) $703,285.71 $800,035.71 $861,804.36 $907,961.88 $1,053,153.68 $1,109,292.23 $1,918,423.56 $(4,500,000.00) (3,796,714.29) (2,996,678.57) $(2,134,874.21) (1,226,912.33) $(173,758.65) $935,533.58 $2,103,957.14 70 71 Net Present Value 72 IRR 73 MIRR 74 Payback Period 75 $723,782.02 11.90% 10.33% 5.2 76 77 78 79 80 81 82 83 Most Likely Case Scenario Analysis R Tp Download 8 Share K L M N X J K L M N P Q R 2021_SUMM_HAD_521_400_940 X Homework Help - Q&A from Onlin X New Week 6 Excel Assignment H X + Office Editing for Docs, Sheets & Slides | chrome-extension://bpmcpldpdmajfigpchkicefoigmkfalc/views/app.html New Week 6 Excel Assignment HAD 521 (1) (3).xlsx C X File Edit Insert Format Help Q Q Calibri 11 B I USA fx A B C E 123456 LL 0 H 7 8 9 10 11 12 13 14 15 16 17 18 19 20 21 22 23 24 25 26 27 28 29 30 31 32 33 34 35 Most Likely Case Scenario Analysis R Tp X Download 8 Share S T U V
Step by Step Solution
There are 3 Steps involved in it

Get step-by-step solutions from verified subject matter experts