

Question: 2:05 AR Assignment Details PSYCH-2A-02 Statistics for Behavioral Sci 20245U Description Look at the graphs below. 1) For each graph, try to interpret the main
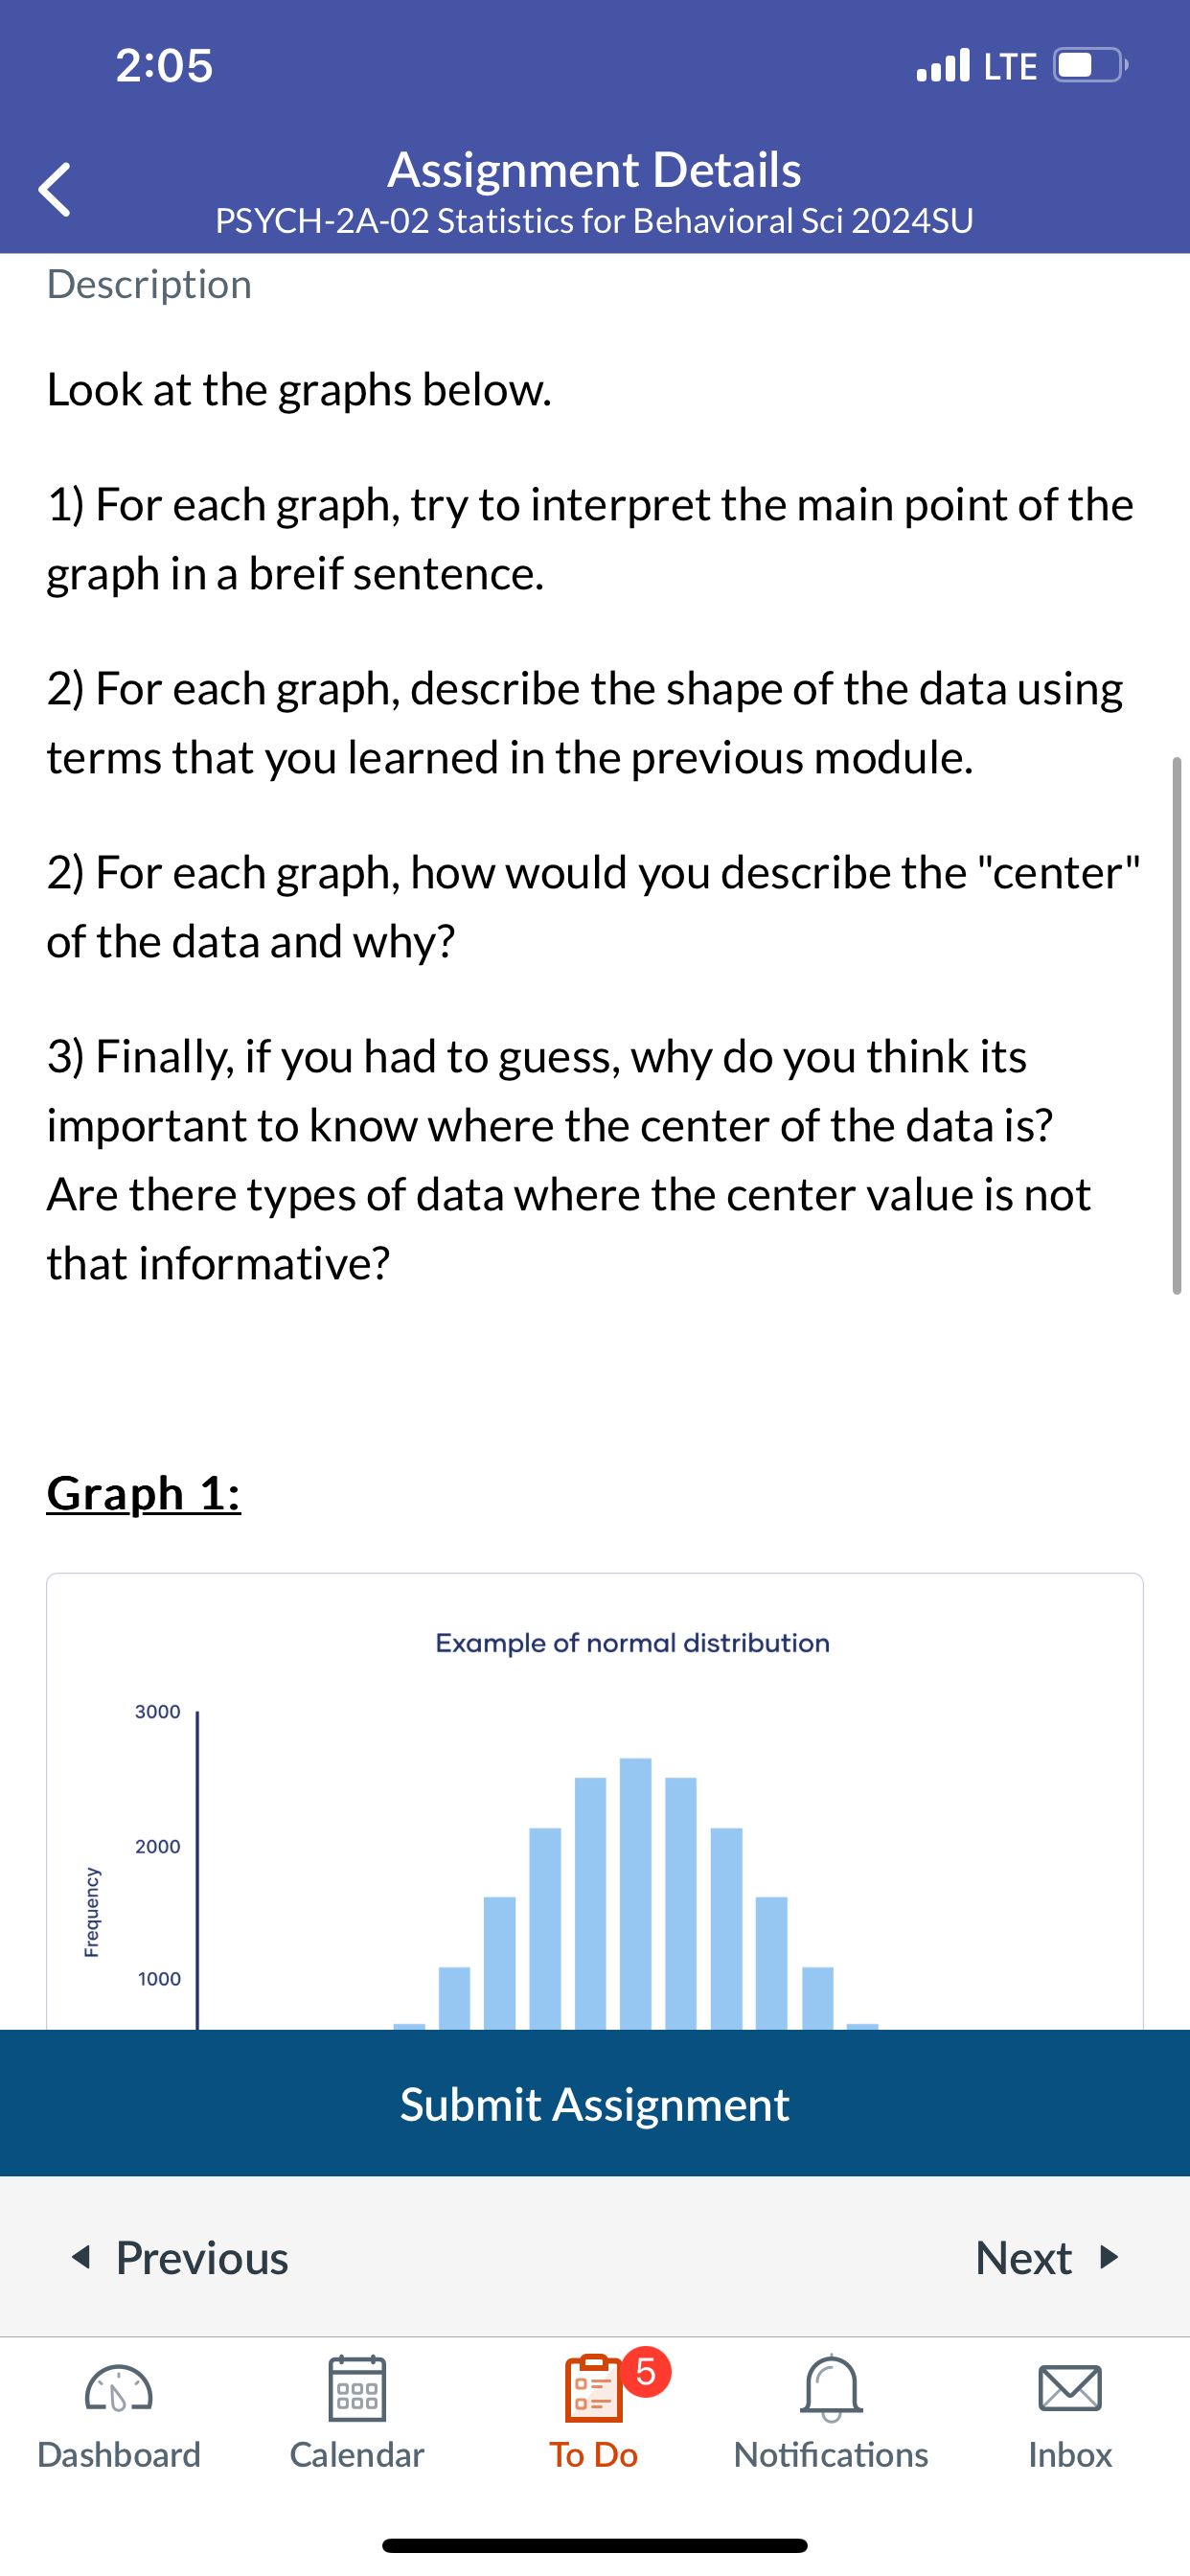
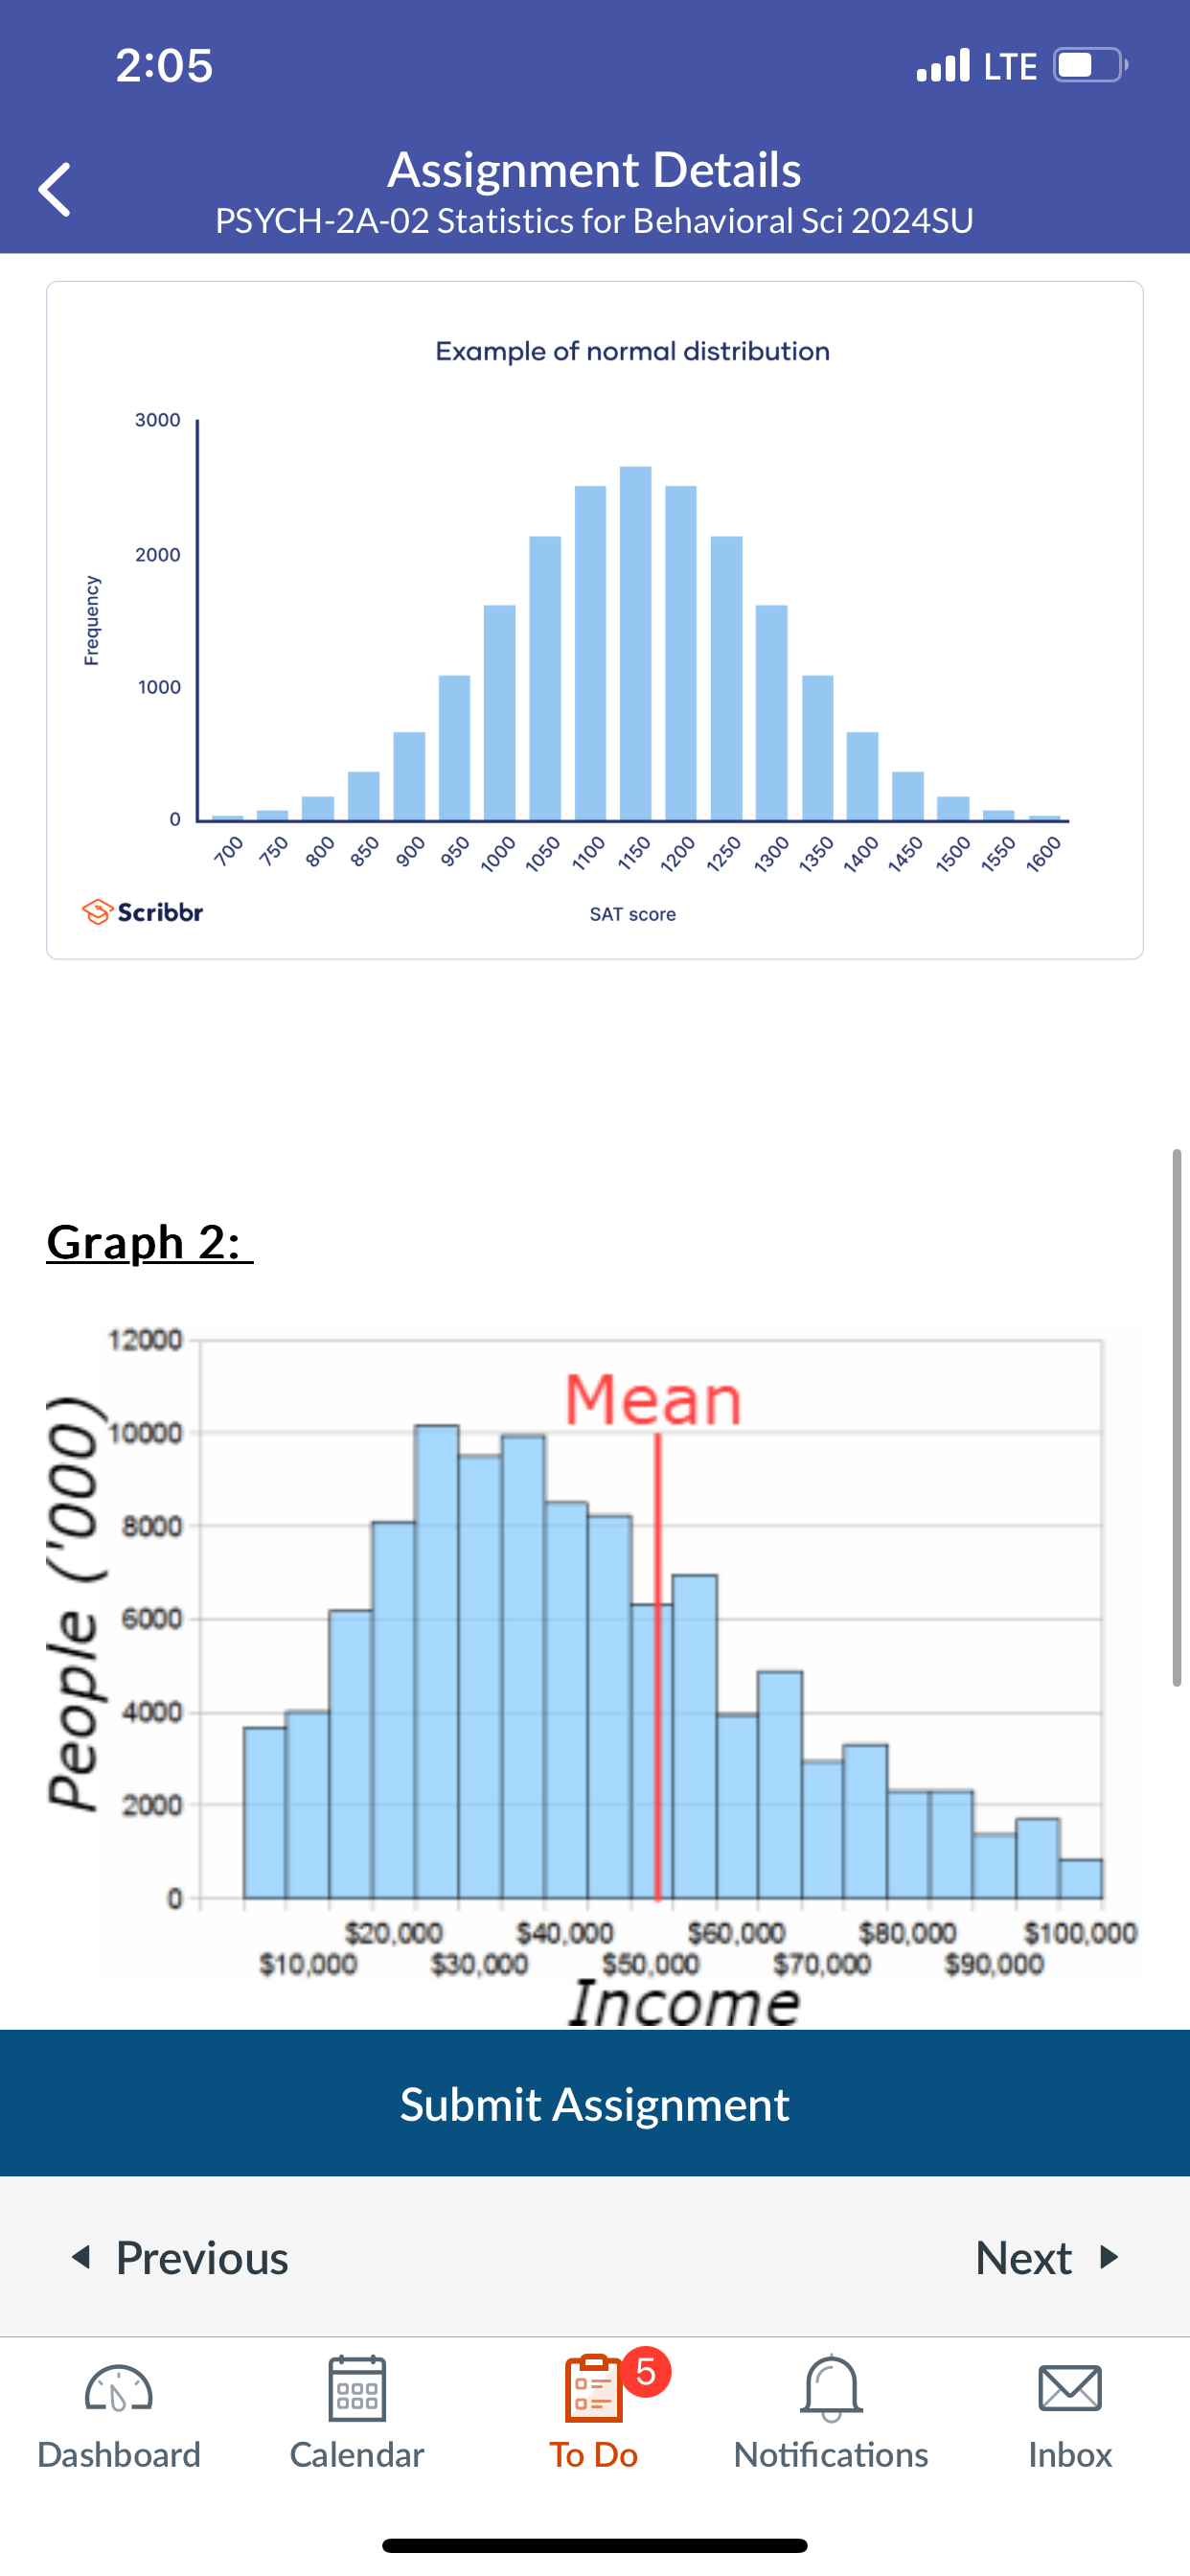
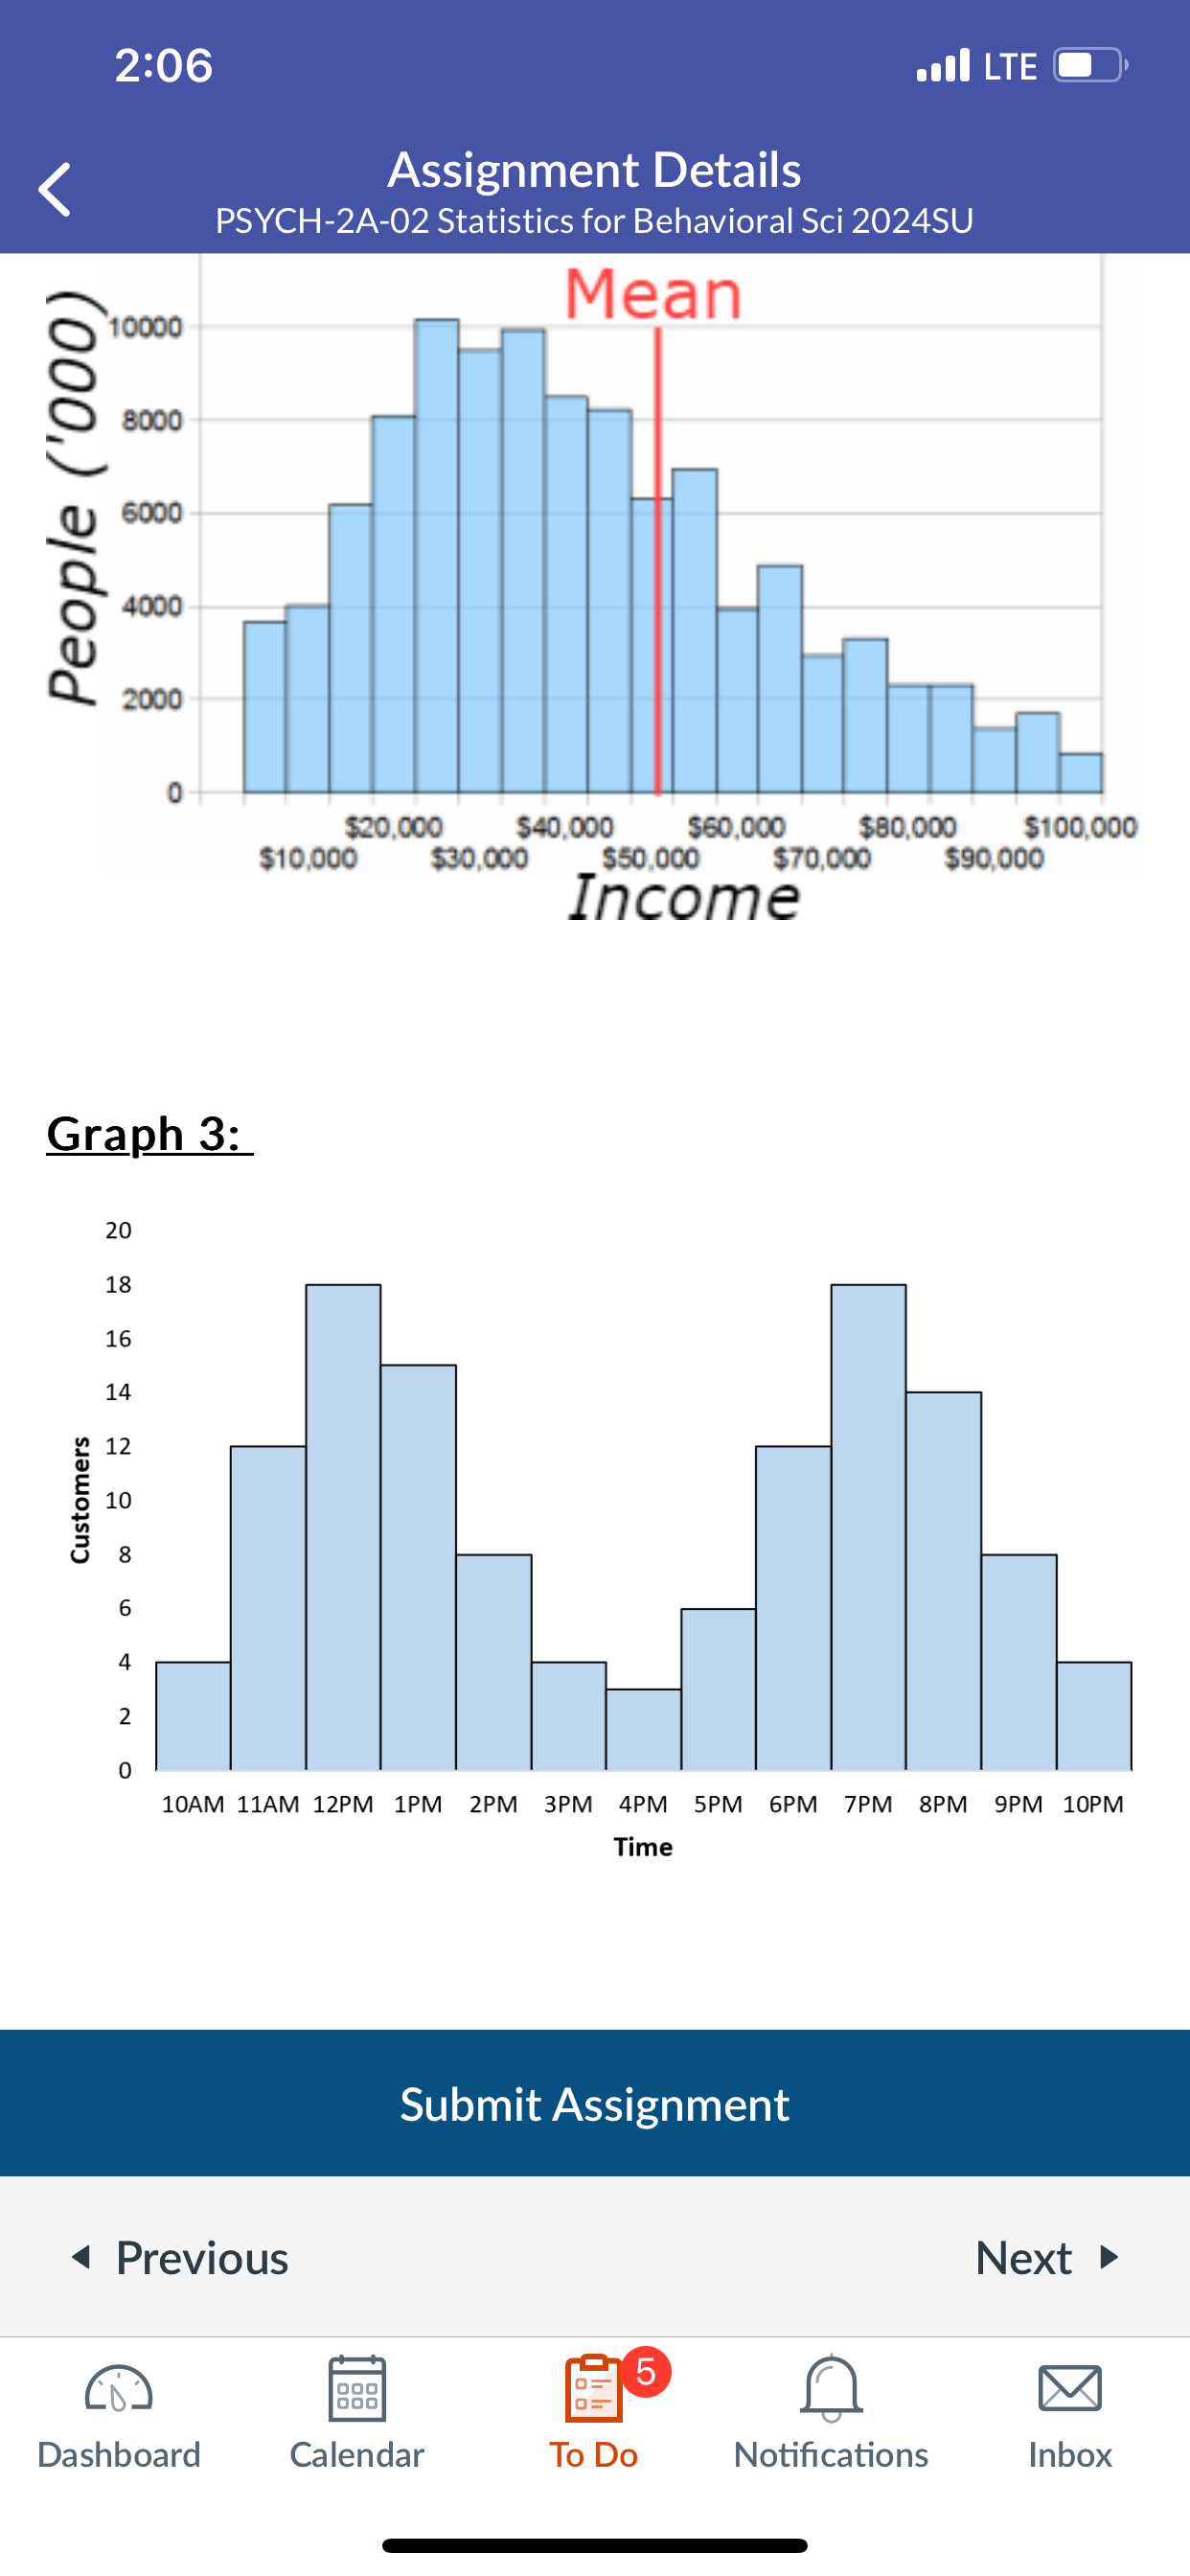
2:05 AR Assignment Details PSYCH-2A-02 Statistics for Behavioral Sci 20245U Description Look at the graphs below. 1) For each graph, try to interpret the main point of the graphin a breif sentence. 2) For each graph, describe the shape of the data using terms that you learned in the previous module. 2) For each graph, how would you describe the "center' of the data and why? 3) Finally, if you had to guess, why do you think its important to know where the center of the datais? Are there types of data where the center value is not that informative? Example of normal distribution 3000 2000 1000 Submit Assignment
Step by Step Solution
There are 3 Steps involved in it
1 Expert Approved Answer
Step: 1 Unlock

Question Has Been Solved by an Expert!
Get step-by-step solutions from verified subject matter experts
Step: 2 Unlock
Step: 3 Unlock