

21 Asian/ Pacific... female 21 White Northeast US Connecticut 3.818 2.5 3.467 3.650 3.589 male Northeast...
Fantastic news! We've Found the answer you've been seeking!
Question:
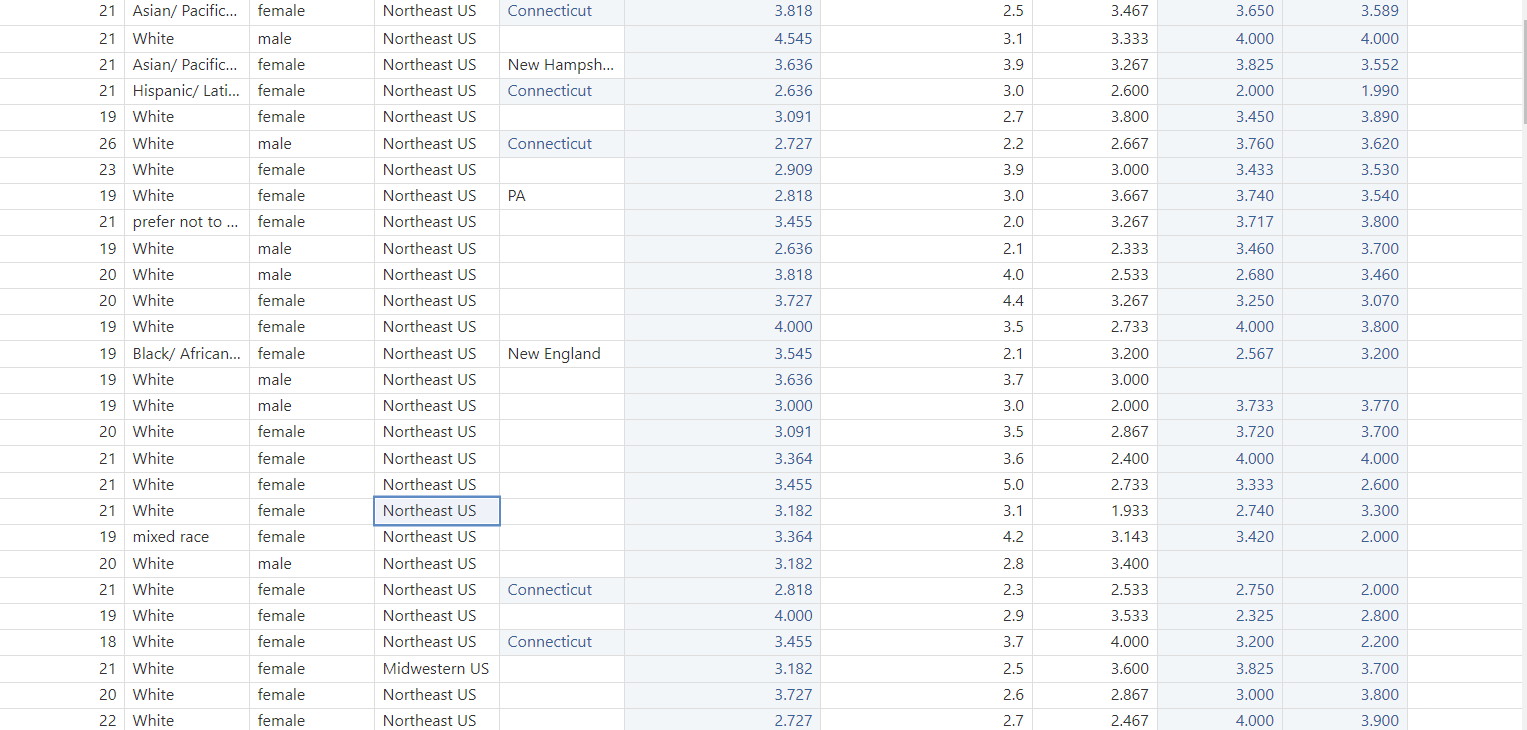
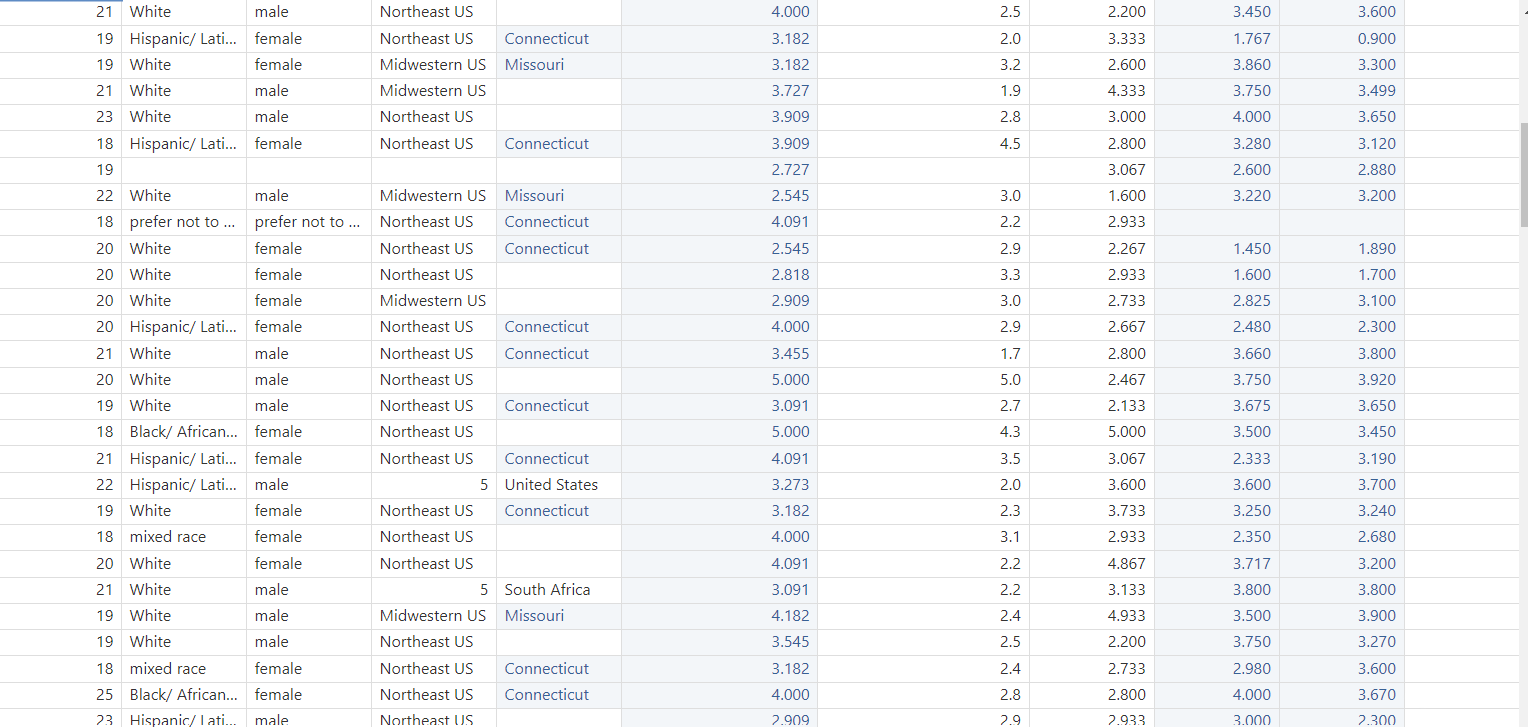
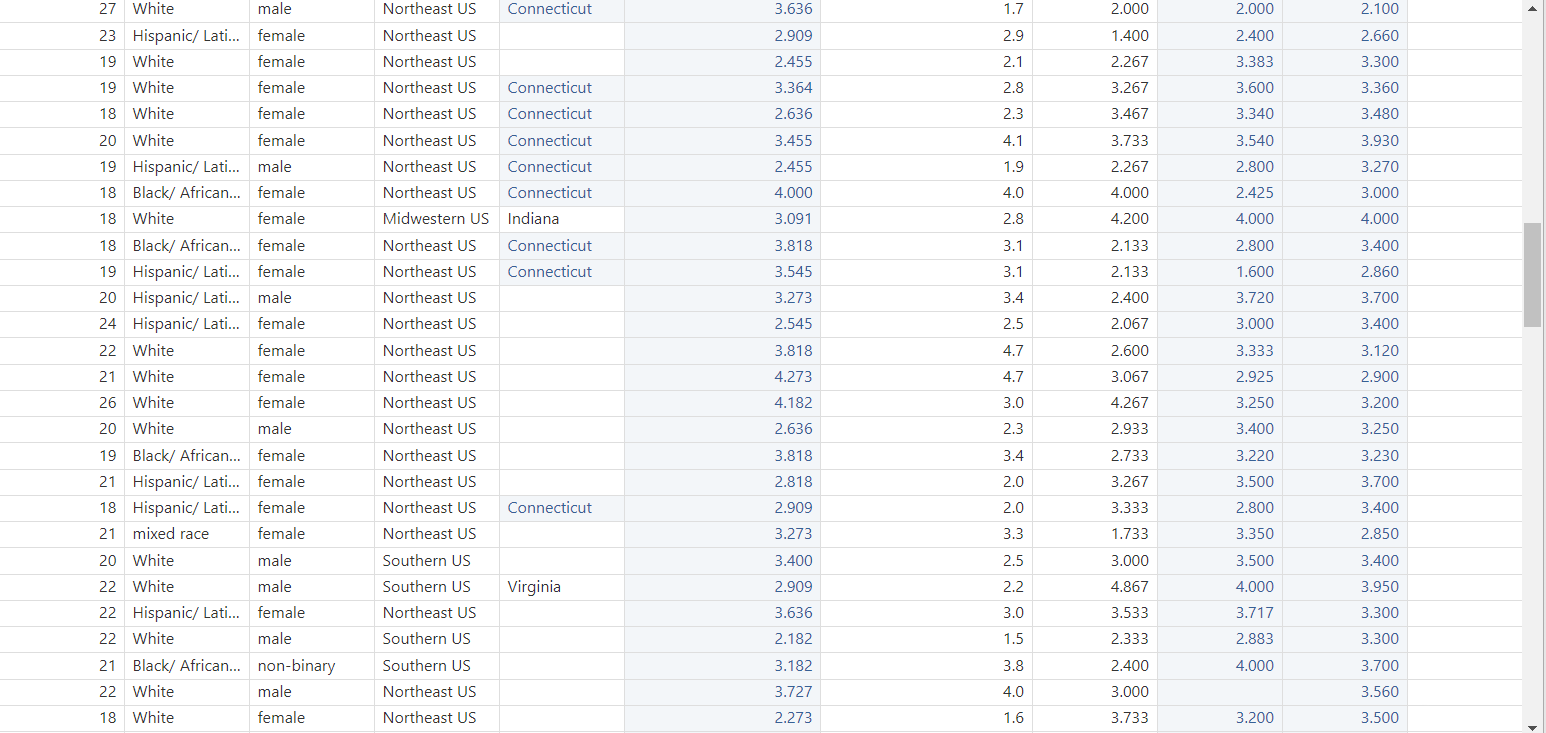

Transcribed Image Text:
21 Asian/ Pacific... female 21 White Northeast US Connecticut 3.818 2.5 3.467 3.650 3.589 male Northeast US 4.545 3.1 3.333 4.000 4.000 21 Asian/ Pacific... female Northeast US New Hampsh... 3.636 3.9 3.267 3.825 3.552 21 Hispanic/Lati... female Northeast US Connecticut 2.636 3.0 2.600 2.000 1.990 19 White female Northeast US 3.091 2.7 3.800 3.450 3.890 26 White male Northeast US Connecticut 2.727 2.2 2.667 3.760 3.620 23 White female Northeast US 2.909 3.9 3.000 3.433 3.530 19 White female Northeast US PA 2.818 3.0 3.667 3.740 3.540 21 prefer not to... female Northeast US 3.455 2.0 3.267 3.717 3.800 19 White male Northeast US 2.636 2.1 2.333 3.460 3.700 20 White male Northeast US 3.818 4.0 2.533 2.680 3.460 20 White female Northeast US 3.727 4.4 3.267 3.250 3.070 19 White female Northeast US 4.000 3.5 2.733 4.000 3.800 19 Black/ African... female Northeast US New England 3.545 2.1 3.200 2.567 3.200 19 White male Northeast US 3.636 3.7 3.000 19 White male Northeast US 3.000 3.0 2.000 3.733 3.770 20 White female Northeast US 3.091 3.5 2.867 3.720 3.700 21 White female Northeast US 3.364 3.6 2.400 4.000 4.000 21 White female Northeast US 3.455 5.0 2.733 3.333 2.600 21 White female Northeast US 3.182 3.1 1.933 2.740 3.300 19 mixed race female Northeast US 3.364 4.2 3.143 3.420 2.000 20 White male Northeast US 3.182 2.8 3.400 21 White female Northeast US Connecticut 2.818 2.3 2.533 2.750 2.000 19 White female Northeast US 4.000 2.9 3.533 2.325 2.800 18 White female Northeast US Connecticut 3.455 3.7 4.000 3.200 2.200 21 White female Midwestern US 3.182 2.5 3.600 3.825 3.700 20 White female Northeast US 3.727 2.6 2.867 3.000 3.800 22 White female Northeast US 2.727 2.7 2.467 4.000 3.900 21 White male Northeast US 4.000 2.5 2.200 3.450 3.600 19 Hispanic/Lati... female Northeast US Connecticut 3.182 2.0 3.333 1.767 0.900 19 White female Midwestern US Missouri 3.182 3.2 2.600 3.860 3.300 21 White male Midwestern US 3.727 1.9 4.333 3.750 3.499 23 White male Northeast US 3.909 2.8 3.000 4.000 3.650 18 Hispanic/Lati... female Northeast US Connecticut 3.909 4.5 2.800 3.280 3.120 19 2.727 3.067 2.600 2.880 22 White male Midwestern US Missouri 2.545 3.0 1.600 3.220 3.200 18 prefer not to... prefer not to... Northeast US Connecticut 4.091 2.2 2.933 20 White female Northeast US Connecticut 2.545 2.9 2.267 1.450 1.890 20 White female Northeast US 2.818 3.3 2.933 1.600 1.700 20 White female Midwestern US 2.909 3.0 2.733 2.825 3.100 20 Hispanic/Lati... female Northeast US Connecticut 4.000 2.9 2.667 2.480 2.300 21 White male Northeast US Connecticut 3.455 1.7 2.800 3.660 3.800 20 White male Northeast US 5.000 5.0 2.467 3.750 3.920 19 White male Northeast US Connecticut 3.091 2.7 2.133 3.675 3.650 18 Black/ African... female Northeast US 5.000 4.3 5.000 3.500 3.450 21 Hispanic/Lati... female Northeast US Connecticut 4.091 3.5 3.067 2.333 3.190 22 Hispanic/Lati... male 19 White 5 United States 3.273 2.0 3.600 3.600 3.700 female Northeast US Connecticut 3.182 2.3 3.733 3.250 3.240 18 mixed race female Northeast US 4.000 3.1 2.933 2.350 2.680 20 White female Northeast US 4.091 2.2 4.867 3.717 3.200 21 White male 5 South Africa 3.091 2.2 3.133 3.800 3.800 19 White male 19 White male Midwestern US Missouri Northeast US 4.182 2.4 4.933 3.500 3.900 3.545 2.5 2.200 3.750 3.270 18 mixed race female Northeast US Connecticut 3.182 2.4 2.733 2.980 3.600 23 Hispanic/Lati... 25 Black/ African... female male Northeast US Connecticut 4.000 2.8 2.800 4.000 3.670 Northeast US 2.909 2.9 2.933 3.000 2.300 27 White male Northeast US Connecticut 3.636 1.7 2.000 2.000 2.100 23 Hispanic/Lati... female Northeast US 2.909 2.9 1.400 2.400 2.660 19 White female Northeast US 2.455 2.1 2.267 3.383 3.300 19 White female Northeast US Connecticut 3.364 2.8 3.267 3.600 3.360 18 White female Northeast US Connecticut 2.636 2.3 3.467 3.340 3.480 20 White female Northeast US Connecticut 3.455 4.1 3.733 3.540 3.930 19 Hispanic/Lati... male Northeast US Connecticut 2.455 1.9 2.267 2.800 3.270 18 Black/ African... female 18 White Northeast US Connecticut 4.000 4.0 4.000 2.425 3.000 female Midwestern US Indiana 3.091 2.8 4.200 4.000 4.000 18 Black/ African... female Northeast US Connecticut 3.818 3.1 2.133 2.800 3.400 19 Hispanic/Lati... female Northeast US Connecticut 3.545 3.1 2.133 1.600 2.860 20 Hispanic/Lati... male Northeast US 3.273 3.4 2.400 3.720 3.700 24 Hispanic/Lati... female Northeast US 2.545 2.5 2.067 3.000 3.400 22 White female Northeast US 3.818 4.7 2.600 3.333 3.120 21 White female Northeast US 4.273 4.7 3.067 2.925 2.900 26 White female Northeast US 4.182 3.0 4.267 3.250 3.200 20 White male Northeast US 2.636 2.3 2.933 3.400 3.250 19 Black/ African... female Northeast US 3.818 3.4 2.733 3.220 3.230 21 Hispanic/Lati... female Northeast US 2.818 2.0 3.267 3.500 3.700 18 Hispanic/Lati... female Northeast US Connecticut 2.909 2.0 3.333 2.800 3.400 21 mixed race female Northeast US 3.273 3.3 1.733 3.350 2.850 20 White male Southern US 3.400 2.5 3.000 3.500 3.400 22 White male Southern US Virginia 2.909 2.2 4.867 4.000 3.950 22 Hispanic/Lati... female Northeast US 3.636 3.0 3.533 3.717 3.300 22 White male Southern US 2.182 1.5 2.333 2.883 3.300 21 Black/ African... non-binary Southern US 3.182 3.8 2.400 4.000 3.700 22 White male Northeast US 3.727 4.0 3.000 3.560 18 White female Northeast US 2.273 1.6 3.733 3.200 3.500 19 White female Southern US 4.000 4.7 3.200 2.600 2.690 23 mixed race female Northeast US 2.909 3.4 3.133 4.000 3.260 22 White male Northeast US 3.727 3.5 2.933 3.200 3.000 21 White female Northeast US 3.364 2.0 3.200 4.000 3.980 22 White male Northeast US 2.909 2.5 3.267 3.600 3.700 21 White male Northeast US Connecticut 2.300 2.0 3.133 3.660 3.600 23 White male Northeast US 3.091 2.7 1.467 2.650 2.500 18 Hispanic/Lati... female Northeast US Connecticut 3.545 2.0 3.733 3.540 3.580 18 Hispanic/Lati... female Northeast US Connecticut 2.818 1.8 3.600 3.940 3.630 18 White female Northeast US Connecticut 3.545 4.1 3.067 1.200 1.920 27 White male Northeast US 3.273 3.3 3.600 3.200 3.400 19 White female Northeast US Connecticut 3.364 3.1 3.333 3.075 2.800 27 Hispanic/Lati... male Northeast US Connecticut 3.273 2.5 3.067 4.000 3.710 22 Asian/ Pacific... male 19 Hispanic/Lati... female 5 Canada 3.636 1.9 2.400 2.700 1.560 20 Asian/ Pacific... male Northeast US Northeast US 4.000 3.8 2.467 2.480 2.800 MA 4.000 2.3 1.867 3.675 3.000 20 prefer not to... prefer not to... Northeast US 4.000 2.1 4.133 3.350 3.700 19 White female Northeast US Connecticut 3.818 3.1 2.400 3.000 2.800 18 Asian/ Pacific... male Midwestern US 3.091 2.8 2.867 4.000 3.930 18 Black/ African... male Northeast US Connecticut 3.091 2.7 3.133 2.620 2.900 21 White male Northeast US New York 2.000 2.0 3.467 3.400 3.500 21 Black/ African... male Northeast US 4.364 4.5 4.133 3.667 3.900 18 Hispanic/Lati... female Northeast US 3.727 4.3 2.067 2.800 3.680 18 Black/ African... male Midwestern US Illinois 5.000 5.0 2.600 3.075 3.200 19 White female Northeast US Connecticut 3.545 3.1 4.533 3.460 4.000 19 White female 3.909 4.0 3.133 3.175 3.550 19 White female Northeast US Connecticut 3.000 2.5 3.533 3.075 3.610 31 White female Northeast US 3.818 3.7 3.533 4.000 3.850 21 Asian/ Pacific... female 21 White Northeast US Connecticut 3.818 2.5 3.467 3.650 3.589 male Northeast US 4.545 3.1 3.333 4.000 4.000 21 Asian/ Pacific... female Northeast US New Hampsh... 3.636 3.9 3.267 3.825 3.552 21 Hispanic/Lati... female Northeast US Connecticut 2.636 3.0 2.600 2.000 1.990 19 White female Northeast US 3.091 2.7 3.800 3.450 3.890 26 White male Northeast US Connecticut 2.727 2.2 2.667 3.760 3.620 23 White female Northeast US 2.909 3.9 3.000 3.433 3.530 19 White female Northeast US PA 2.818 3.0 3.667 3.740 3.540 21 prefer not to... female Northeast US 3.455 2.0 3.267 3.717 3.800 19 White male Northeast US 2.636 2.1 2.333 3.460 3.700 20 White male Northeast US 3.818 4.0 2.533 2.680 3.460 20 White female Northeast US 3.727 4.4 3.267 3.250 3.070 19 White female Northeast US 4.000 3.5 2.733 4.000 3.800 19 Black/ African... female Northeast US New England 3.545 2.1 3.200 2.567 3.200 19 White male Northeast US 3.636 3.7 3.000 19 White male Northeast US 3.000 3.0 2.000 3.733 3.770 20 White female Northeast US 3.091 3.5 2.867 3.720 3.700 21 White female Northeast US 3.364 3.6 2.400 4.000 4.000 21 White female Northeast US 3.455 5.0 2.733 3.333 2.600 21 White female Northeast US 3.182 3.1 1.933 2.740 3.300 19 mixed race female Northeast US 3.364 4.2 3.143 3.420 2.000 20 White male Northeast US 3.182 2.8 3.400 21 White female Northeast US Connecticut 2.818 2.3 2.533 2.750 2.000 19 White female Northeast US 4.000 2.9 3.533 2.325 2.800 18 White female Northeast US Connecticut 3.455 3.7 4.000 3.200 2.200 21 White female Midwestern US 3.182 2.5 3.600 3.825 3.700 20 White female Northeast US 3.727 2.6 2.867 3.000 3.800 22 White female Northeast US 2.727 2.7 2.467 4.000 3.900 21 White male Northeast US 4.000 2.5 2.200 3.450 3.600 19 Hispanic/Lati... female Northeast US Connecticut 3.182 2.0 3.333 1.767 0.900 19 White female Midwestern US Missouri 3.182 3.2 2.600 3.860 3.300 21 White male Midwestern US 3.727 1.9 4.333 3.750 3.499 23 White male Northeast US 3.909 2.8 3.000 4.000 3.650 18 Hispanic/Lati... female Northeast US Connecticut 3.909 4.5 2.800 3.280 3.120 19 2.727 3.067 2.600 2.880 22 White male Midwestern US Missouri 2.545 3.0 1.600 3.220 3.200 18 prefer not to... prefer not to... Northeast US Connecticut 4.091 2.2 2.933 20 White female Northeast US Connecticut 2.545 2.9 2.267 1.450 1.890 20 White female Northeast US 2.818 3.3 2.933 1.600 1.700 20 White female Midwestern US 2.909 3.0 2.733 2.825 3.100 20 Hispanic/Lati... female Northeast US Connecticut 4.000 2.9 2.667 2.480 2.300 21 White male Northeast US Connecticut 3.455 1.7 2.800 3.660 3.800 20 White male Northeast US 5.000 5.0 2.467 3.750 3.920 19 White male Northeast US Connecticut 3.091 2.7 2.133 3.675 3.650 18 Black/ African... female Northeast US 5.000 4.3 5.000 3.500 3.450 21 Hispanic/Lati... female Northeast US Connecticut 4.091 3.5 3.067 2.333 3.190 22 Hispanic/Lati... male 19 White 5 United States 3.273 2.0 3.600 3.600 3.700 female Northeast US Connecticut 3.182 2.3 3.733 3.250 3.240 18 mixed race female Northeast US 4.000 3.1 2.933 2.350 2.680 20 White female Northeast US 4.091 2.2 4.867 3.717 3.200 21 White male 5 South Africa 3.091 2.2 3.133 3.800 3.800 19 White male 19 White male Midwestern US Missouri Northeast US 4.182 2.4 4.933 3.500 3.900 3.545 2.5 2.200 3.750 3.270 18 mixed race female Northeast US Connecticut 3.182 2.4 2.733 2.980 3.600 23 Hispanic/Lati... 25 Black/ African... female male Northeast US Connecticut 4.000 2.8 2.800 4.000 3.670 Northeast US 2.909 2.9 2.933 3.000 2.300 27 White male Northeast US Connecticut 3.636 1.7 2.000 2.000 2.100 23 Hispanic/Lati... female Northeast US 2.909 2.9 1.400 2.400 2.660 19 White female Northeast US 2.455 2.1 2.267 3.383 3.300 19 White female Northeast US Connecticut 3.364 2.8 3.267 3.600 3.360 18 White female Northeast US Connecticut 2.636 2.3 3.467 3.340 3.480 20 White female Northeast US Connecticut 3.455 4.1 3.733 3.540 3.930 19 Hispanic/Lati... male Northeast US Connecticut 2.455 1.9 2.267 2.800 3.270 18 Black/ African... female 18 White Northeast US Connecticut 4.000 4.0 4.000 2.425 3.000 female Midwestern US Indiana 3.091 2.8 4.200 4.000 4.000 18 Black/ African... female Northeast US Connecticut 3.818 3.1 2.133 2.800 3.400 19 Hispanic/Lati... female Northeast US Connecticut 3.545 3.1 2.133 1.600 2.860 20 Hispanic/Lati... male Northeast US 3.273 3.4 2.400 3.720 3.700 24 Hispanic/Lati... female Northeast US 2.545 2.5 2.067 3.000 3.400 22 White female Northeast US 3.818 4.7 2.600 3.333 3.120 21 White female Northeast US 4.273 4.7 3.067 2.925 2.900 26 White female Northeast US 4.182 3.0 4.267 3.250 3.200 20 White male Northeast US 2.636 2.3 2.933 3.400 3.250 19 Black/ African... female Northeast US 3.818 3.4 2.733 3.220 3.230 21 Hispanic/Lati... female Northeast US 2.818 2.0 3.267 3.500 3.700 18 Hispanic/Lati... female Northeast US Connecticut 2.909 2.0 3.333 2.800 3.400 21 mixed race female Northeast US 3.273 3.3 1.733 3.350 2.850 20 White male Southern US 3.400 2.5 3.000 3.500 3.400 22 White male Southern US Virginia 2.909 2.2 4.867 4.000 3.950 22 Hispanic/Lati... female Northeast US 3.636 3.0 3.533 3.717 3.300 22 White male Southern US 2.182 1.5 2.333 2.883 3.300 21 Black/ African... non-binary Southern US 3.182 3.8 2.400 4.000 3.700 22 White male Northeast US 3.727 4.0 3.000 3.560 18 White female Northeast US 2.273 1.6 3.733 3.200 3.500 19 White female Southern US 4.000 4.7 3.200 2.600 2.690 23 mixed race female Northeast US 2.909 3.4 3.133 4.000 3.260 22 White male Northeast US 3.727 3.5 2.933 3.200 3.000 21 White female Northeast US 3.364 2.0 3.200 4.000 3.980 22 White male Northeast US 2.909 2.5 3.267 3.600 3.700 21 White male Northeast US Connecticut 2.300 2.0 3.133 3.660 3.600 23 White male Northeast US 3.091 2.7 1.467 2.650 2.500 18 Hispanic/Lati... female Northeast US Connecticut 3.545 2.0 3.733 3.540 3.580 18 Hispanic/Lati... female Northeast US Connecticut 2.818 1.8 3.600 3.940 3.630 18 White female Northeast US Connecticut 3.545 4.1 3.067 1.200 1.920 27 White male Northeast US 3.273 3.3 3.600 3.200 3.400 19 White female Northeast US Connecticut 3.364 3.1 3.333 3.075 2.800 27 Hispanic/Lati... male Northeast US Connecticut 3.273 2.5 3.067 4.000 3.710 22 Asian/ Pacific... male 19 Hispanic/Lati... female 5 Canada 3.636 1.9 2.400 2.700 1.560 20 Asian/ Pacific... male Northeast US Northeast US 4.000 3.8 2.467 2.480 2.800 MA 4.000 2.3 1.867 3.675 3.000 20 prefer not to... prefer not to... Northeast US 4.000 2.1 4.133 3.350 3.700 19 White female Northeast US Connecticut 3.818 3.1 2.400 3.000 2.800 18 Asian/ Pacific... male Midwestern US 3.091 2.8 2.867 4.000 3.930 18 Black/ African... male Northeast US Connecticut 3.091 2.7 3.133 2.620 2.900 21 White male Northeast US New York 2.000 2.0 3.467 3.400 3.500 21 Black/ African... male Northeast US 4.364 4.5 4.133 3.667 3.900 18 Hispanic/Lati... female Northeast US 3.727 4.3 2.067 2.800 3.680 18 Black/ African... male Midwestern US Illinois 5.000 5.0 2.600 3.075 3.200 19 White female Northeast US Connecticut 3.545 3.1 4.533 3.460 4.000 19 White female 3.909 4.0 3.133 3.175 3.550 19 White female Northeast US Connecticut 3.000 2.5 3.533 3.075 3.610 31 White female Northeast US 3.818 3.7 3.533 4.000 3.850
Expert Answer:

Posted Date:
Students also viewed these mathematics questions
-
As an HR director for IMF Plastics Manufacturing, you receive a phone call about communicating changes made by the company to provide additional shifts.As soon as the call ends, you begin the process...
-
Country A and country B both have the production function: Y = F(K, L) = K 1/2 L 1/2 . Assume that in both countries capital depreciates at a rate of 10% each year. (Assume no population growth and...
-
Glavine & Co. produces a single product, each unit of which requires three direct labor hours (DLHs). Practical capacity (for setting the factory overhead application rate) is 30,000 DLHs, on an...
-
The following costs were incurred in April by Riders Corp., which produces customized bicycles: The balance in Work in Process Inventory on April 1 was \(\$ 10,920\), which consisted of \(\$ 7,280\)...
-
Genix, Inc., has contracted to sell Larson five hundred washing machines of a certain model at list price. Genix is to ship the goods on or before December 1. Genix produces one thousand washing...
-
1. Briefly describe fraud rate and insult rate as used in biometric recognition. 2.Describe the two popular uses for transport mode VPNs. 3.List and briefly explain 5 properties a biometric...
-
Akmal Bhd. reapportions the costs incurred by two service departments, materials handling and inspection, to the three production departments, machining, finishing and assembly. The following are the...
-
You plan to purchase a $150,000 house using a 15-year mortgage obtained from your local credit union. The mortgage rate offered to you is 7.5 percent. You will make a down payment of 20 percent of...
-
You are looking at to invest $100,000 for the 12 years. You have already identified two possible mutual funds: Fund A- .09% front-end load and an expected 13% return Fund B- .03% front-end load and...
-
Higgledy Piggledy Ltd. has expected EBIT = $2,750.00, debt with a face and market value of $10,500.00 paying 6% annual coupon, and an unlevered cost of capital of 9%. If the tax rate is 40%, what is...
-
An electron with a speed of 6.72 108 cm/s in the positive direction of an x axis enters an electric field of magnitude 2.81 103 N/C, traveling along a field line in the direction that retards its...
-
You win the lottery and are faced with two choices (both pre-tax): you can either receive (i) 100 million in cash today, or (ii) receive an annuity of 10 million per year for the next 20 years...
-
In the projective plane, the line passing through points (-1: 4:1) and (1:0:-2) is given by (a: 1: c), where a= C=
-
Why are stocks usually more risky than bonds?

Study smarter with the SolutionInn App