

Question: 2.1 List three steps to summarize a single categorical variable data (3) 2.2 Example of graphical representation of data (2) 2.3 The job grade (A,B,C,D)
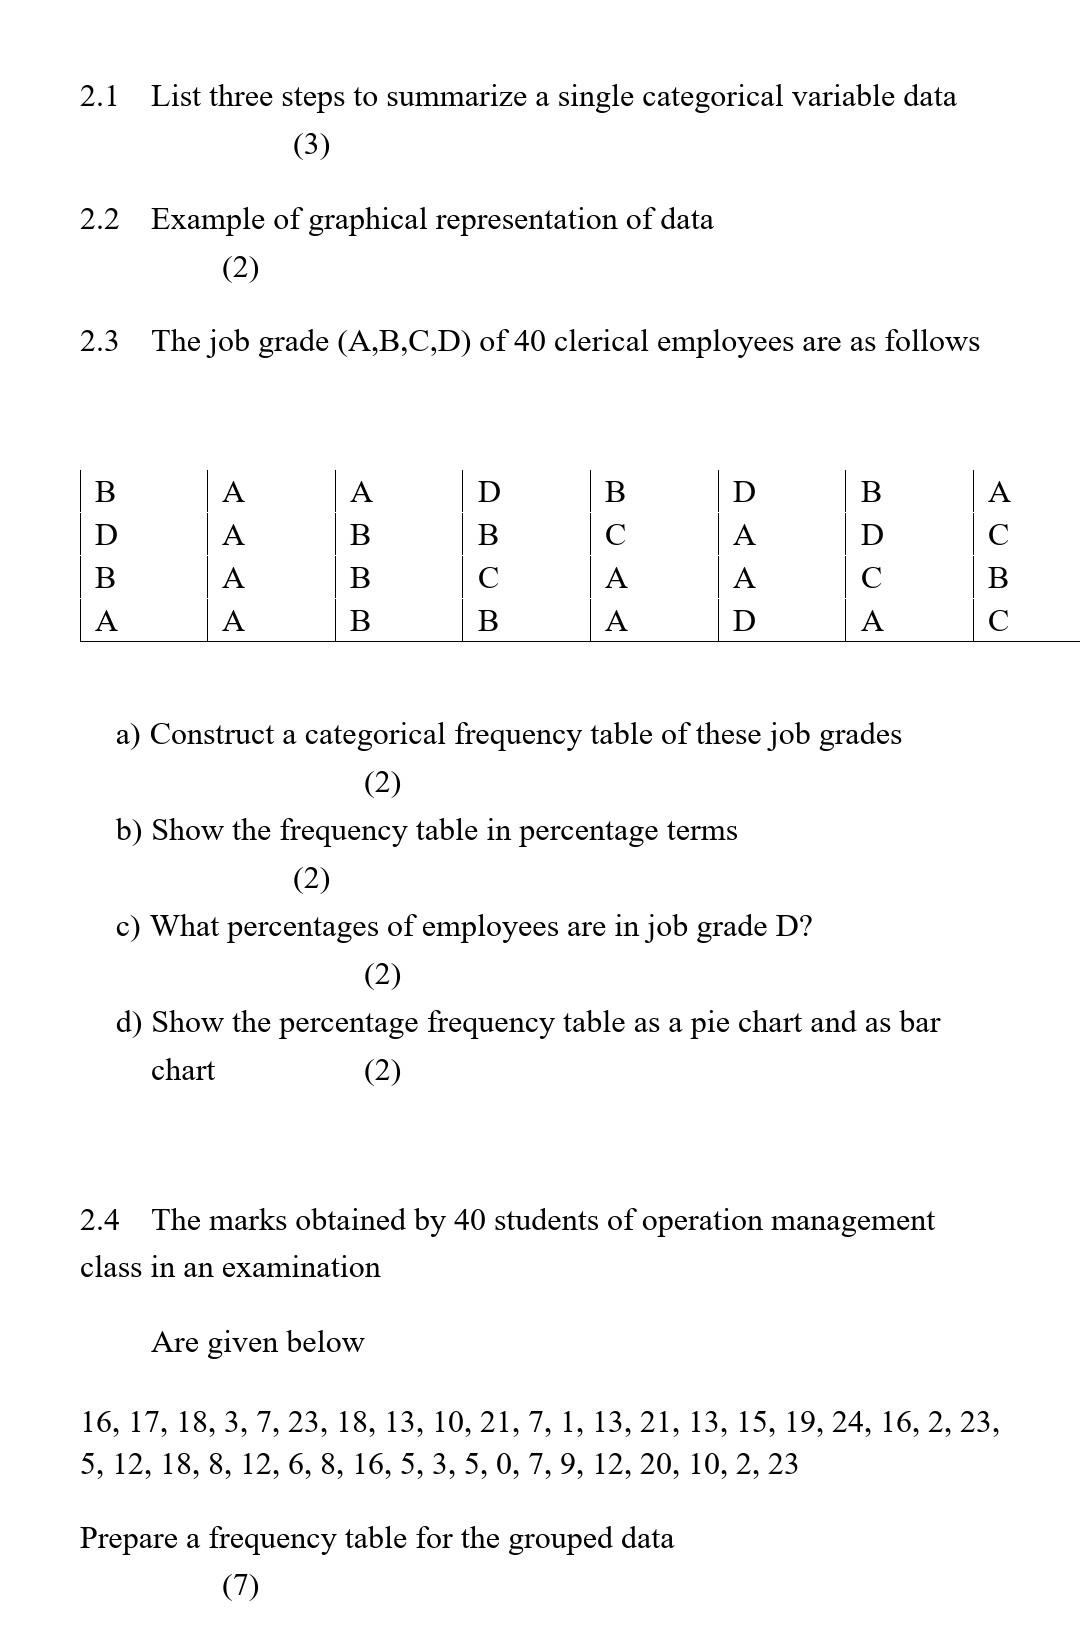
2.1 List three steps to summarize a single categorical variable data (3) 2.2 Example of graphical representation of data (2) 2.3 The job grade (A,B,C,D) of 40 clerical employees are as follows B D B D B A B A D . A B A A B A B B A D A a) Construct a categorical frequency table of these job grades (2) b) Show the frequency table in percentage terms (2) c) What percentages of employees are in job grade D? (2) d) Show the percentage frequency table as a pie chart and as bar chart (2) 2.4 The marks obtained by 40 students of operation management class in an examination Are given below 16, 17, 18, 3, 7, 23, 18, 13, 10, 21, 7, 1, 13, 21, 13, 15, 19, 24, 16, 2, 23, 5, 12, 18, 8, 12, 6, 8, 16, 5, 3, 5, 0, 7, 9, 12, 20, 10, 2, 23 Prepare a frequency table for the grouped data (7)
Step by Step Solution
There are 3 Steps involved in it
1 Expert Approved Answer
Step: 1 Unlock

Question Has Been Solved by an Expert!
Get step-by-step solutions from verified subject matter experts
Step: 2 Unlock
Step: 3 Unlock