

Question: 2.1. Study the information provided below and answer the following questions: INFORMATION Consider a lotiery with three possible outcomes: R125 000 will be received with
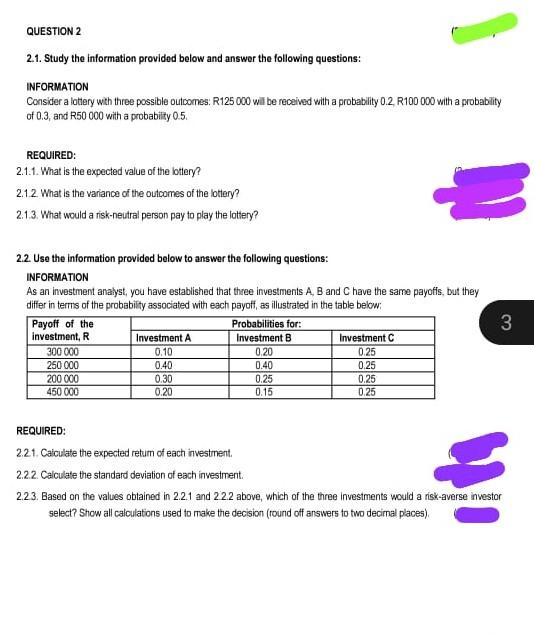
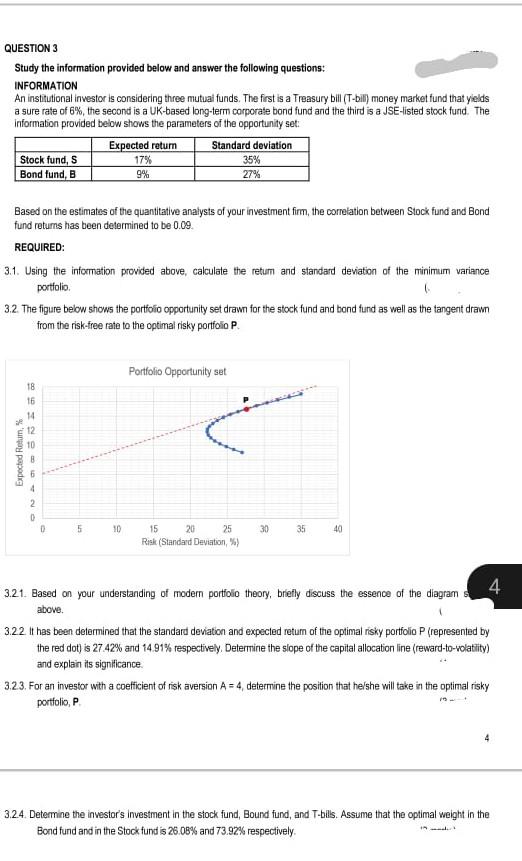
2.1. Study the information provided below and answer the following questions: INFORMATION Consider a lotiery with three possible outcomes: R125 000 will be received with a probability 0.2, R100 000 with a probablity of 0.3 , and R50000 with a probabiti 0.5 . REQUIRED: 2.1.1. What is the expected value of the lotiery? 2.1.2. What is the variance of the outcomes of the lotlery? 2.1.3. What would a risk-neutral person pay to play the lottery? 2.2. Use the information provided below to answar the following questions: INFORMATION As an investment analyst, you have established that three investments A, B and C have the same payoffs, but they differ in terms of the probability associated with each payoff, as illustrated in the table below: REQUIRED: 2.21. Caiculate the expected retum of each investment. 2.2.2. Calculate the standard deviation of each investrment. 2.23. Based on the values obtained in 2.2 .1 and 2.2 .2 above, which of the three investments would a risk-averse investor select? Show all calculations used to make the decision (round off answers to two decimal places). QUESTION 3 Study the information provided below and answer the following questions: INFORMATION An institutional investor is considering three mutual funds. The first is a Treasury bill (T-bili) money market fund that yelds a sure rate of 6%, the second is a UK-based long-term corporate bond fund and the third is a JSE-listed stock fund. The information provided bebow shows the parameters of the opportunily set: Based on the estimates of the quantitative analysts of your investment firm, the correlation between Stock fund and Bond fund returns has been determined to be 0.09 . REQUIRED: 3.1. Using the information provided above, calculate the retum and standard deviation of the minimum variance portiolio. 3.2. The figure below shows the portiolio opportunity set drawn for the stock fund and bond fund as well as the tangent drawn from the risk-free rate to the optimal risky portiolio P. 3.21. Based an your understanding of modern portfolio theory, brefly discuss the essence of the diagram above. 3.2.2. It has been determined that the standard deviation and expected retum of the optimal risky portfolio P (represented by the red dot) is 27.42% and 14.91% respectively. Determine the slope of the capital allocation line (reward-to-wolatiity) and explain its signilicance. 3.23. For an investor with a coefficient of risk aversion A=4, determine the position that helshe will take in the optimal risky portiolio, P 4
Step by Step Solution
There are 3 Steps involved in it

Get step-by-step solutions from verified subject matter experts