

Question: 2.1. Using the information given above, construct Scatter plot 1 and Scatter plot 2. Write a brief comment interpreting the information. 2. For the next
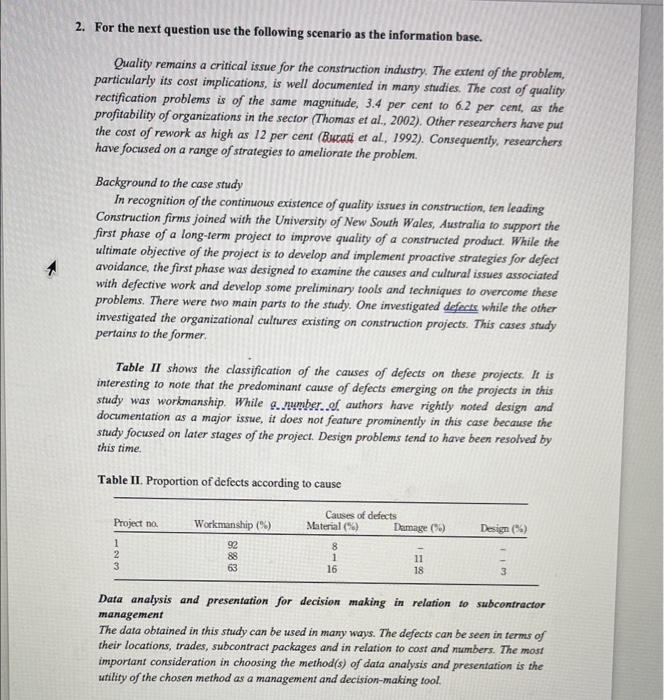
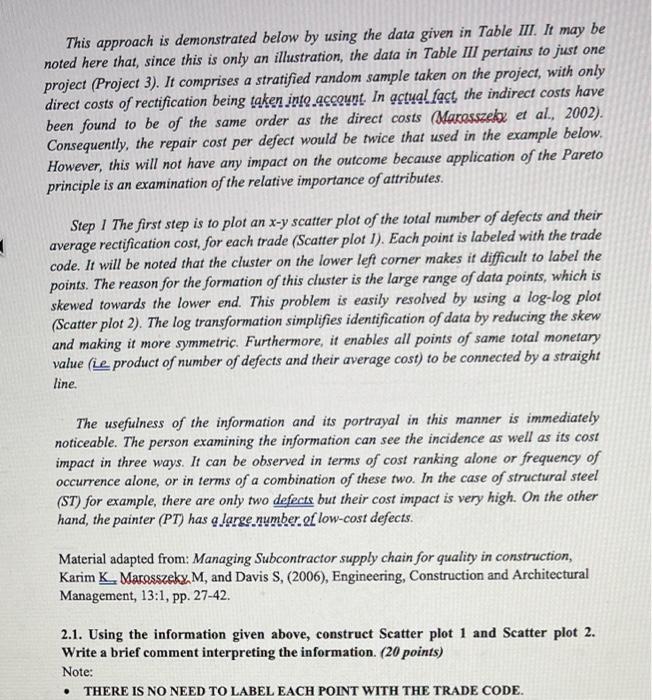
2. For the next question use the following scenario as the information base. Quality remains a critical issue for the construction industry. The extent of the problem, particularly its cost implications, is well documented in many studies. The cost of quality rectification problems is of the same magnitude, 3.4 per cent to 6.2 per cent, as the profitability of organizations in the sector (Thomas et al., 2002). Other researchers have put the cost of rework as high as 12 per cent (Butati et al., 1992). Consequently, researchers have focused on a range of strategies to ameliorate the problem. Background to the case study In recognition of the continuous existence of quality issues in construction, ten leading Construction firms joined with the University of New South Wales, Australia to support the first phase of a long-term project to improve quality of a constructed product. While the ultimate objective of the project is to develop and implement proactive strategies for defect avoidance, the first phase was designed to examine the causes and cultural issues associated with defective work and develop some preliminary tools and techniques to overcome these problems. There were two main parts to the study. One investigated defects while the other investigated the organizational cultures existing on construction projects. This cases study pertains to the former Table II shows the classification of the causes of defects on these projects. It is interesting to note that the predominant cause of defects emerging on the projects in this study was workmanship. While a number. of authors have rightly noted design and documentation as a major issue, it does not feature prominently in this case because the study focused on later stages of the project. Design problems tend to have been resolved by this time Table II. Proportion of defects according to cause Project no Workmanship (%) Causes of defects Material (%) Damage (96) Design (3) 8 1 2 3 S883 63 16 11 18 3 Data analysis and presentation for decision making in relation to subcontractor management The data obtained in this study can be used in many ways. The defects can be seen in terms of their locations, trades, subcontract packages and in relation to cost and numbers. The most important consideration in choosing the method(s) of data analysis and presentation is the utility of the chosen method as a management and decision-making tool This approach is demonstrated below by using the data given in Table III. It may be noted here that, since this is only an illustration, the data in Table III pertains to just one project (Project 3). It comprises a stratified random sample taken on the project, with only direct costs of rectification being taken into account. In actual fact, the indirect costs have been found to be of the same order as the direct costs (Marosszekx et al, 2002). Consequently, the repair cost per defect would be twice that used in the example below. However, this will not have any impact on the outcome because application of the Pareto principle is an examination of the relative importance of attributes. 1 Step 1 The first step is to plot an x-y scatter plot of the total number of defects and their average rectification cost, for each trade (Scatter plot 1). Each point is labeled with the trade code. It will be noted that the cluster on the lower left corner makes it difficult to label the points. The reason for the formation of this cluster is the large range of data points, which is skewed towards the lower end. This problem is easily resolved by using a log-log plot (Scatter plot 2). The log transformation simplifies identification of data by reducing the skew and making it more symmetric. Furthermore, it enables all points of same total monetary value (ie product of number of defects and their average cost) to be connected by a straight line. The usefulness of the information and its portrayal in this manner is immediately noticeable. The person examining the information can see the incidence as well as its cost impact in three ways. It can be observed in terms of cost ranking alone or frequency of occurrence alone, or in terms of a combination of these two. In the case of structural steel (ST) for example, there are only two defects but their cost impact is very high. On the other hand, the painter (PT) has a large number of low-cost defects. Material adapted from: Managing Subcontractor supply chain for quality in construction, Karim K. Marosszekx, M, and Davis S. (2006), Engineering, Construction and Architectural Management, 13:1, pp. 27-42. 2.1. Using the information given above, construct Scatter plot 1 and Scatter plot 2. Write a brief comment interpreting the information. (20 points) Note: THERE IS NO NEED TO LABEL EACH POINT WITH THE TRADE CODE
Step by Step Solution
There are 3 Steps involved in it

Get step-by-step solutions from verified subject matter experts