

Question: 2.1.6 2.1.7 2.1.8 2.1.9 Does this data set show symmetrical (normal) distribution or is it skewed - left or right? Explain your answer. Draw an
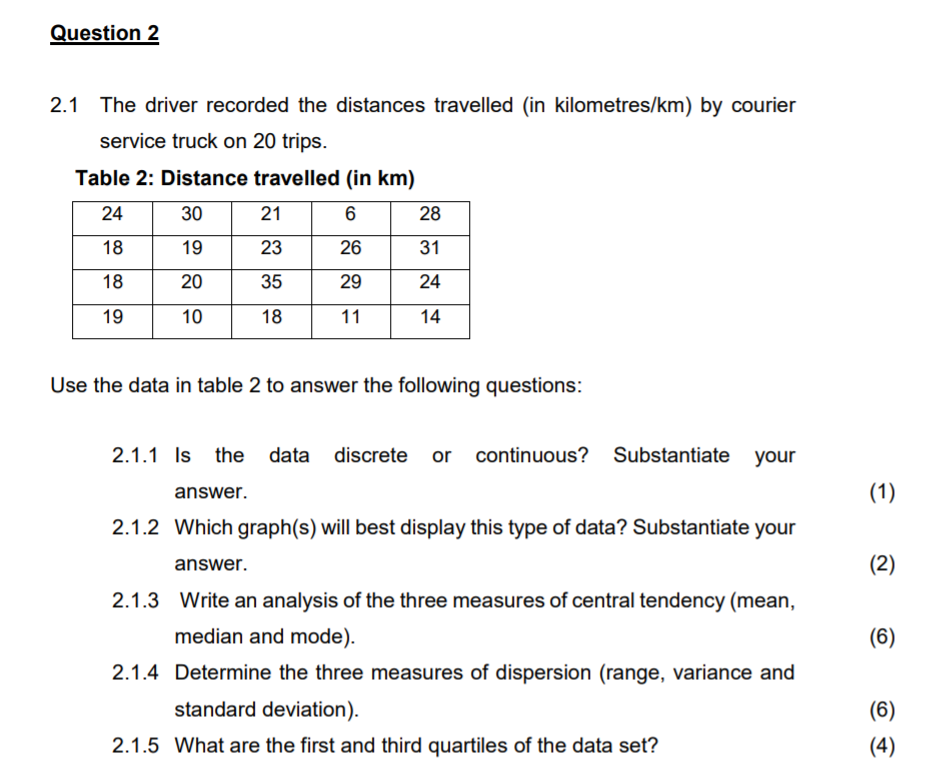
2.1.6 2.1.7 2.1.8 2.1.9 Does this data set show symmetrical (normal) distribution or is it skewed - left or right? Explain your answer. Draw an ordered stem-and-Ieaf diagram to organise this data. Use the class intervals 0 5x59, 10 5x519.20 5x5 29, 30 5x S 39. etc, to construct a frequency table for the data in table 2. Remember. a frequency table should have a tally column. Using the same frequency table drawn up in 2.1.8 and class boundaries of 0 s x 5 9,10 s x s 19. 20 51 s 29. 30 s x 539, etc, construct a histogram to represent the data. (2) (4) (3) (5) 9% 2.1 The driver recorded the distances travelled (in kilometresfkm} by courier service truck on 20 trips. Table 2: Distance travelled (In km) Use the data in table 2 to answer the following questions: 2.1.1 Is the data discrete or continuous? Substantiate your answer. 2.1.2 Which graph(s) will best display this type of data? Substantiate your answer. 2.1.3 Write an analysis of the three measures of central tendency (mean. median and mode). 2.1.4 Determine the three measures of dispersion (range. variance and standard deviation). 2.1.5 What are the first and third quartiles oi the data set? (1) (2) (6) (6) (4)
Step by Step Solution
There are 3 Steps involved in it

Get step-by-step solutions from verified subject matter experts