

Question: 22. Chapter ma2pe09r, Section .16, Problem 040 (ID: 040.16.MANK09) Figure 16-3 1200 1100 1000 900 800 700 PRICE 600 500 400 Demand 300 200 100
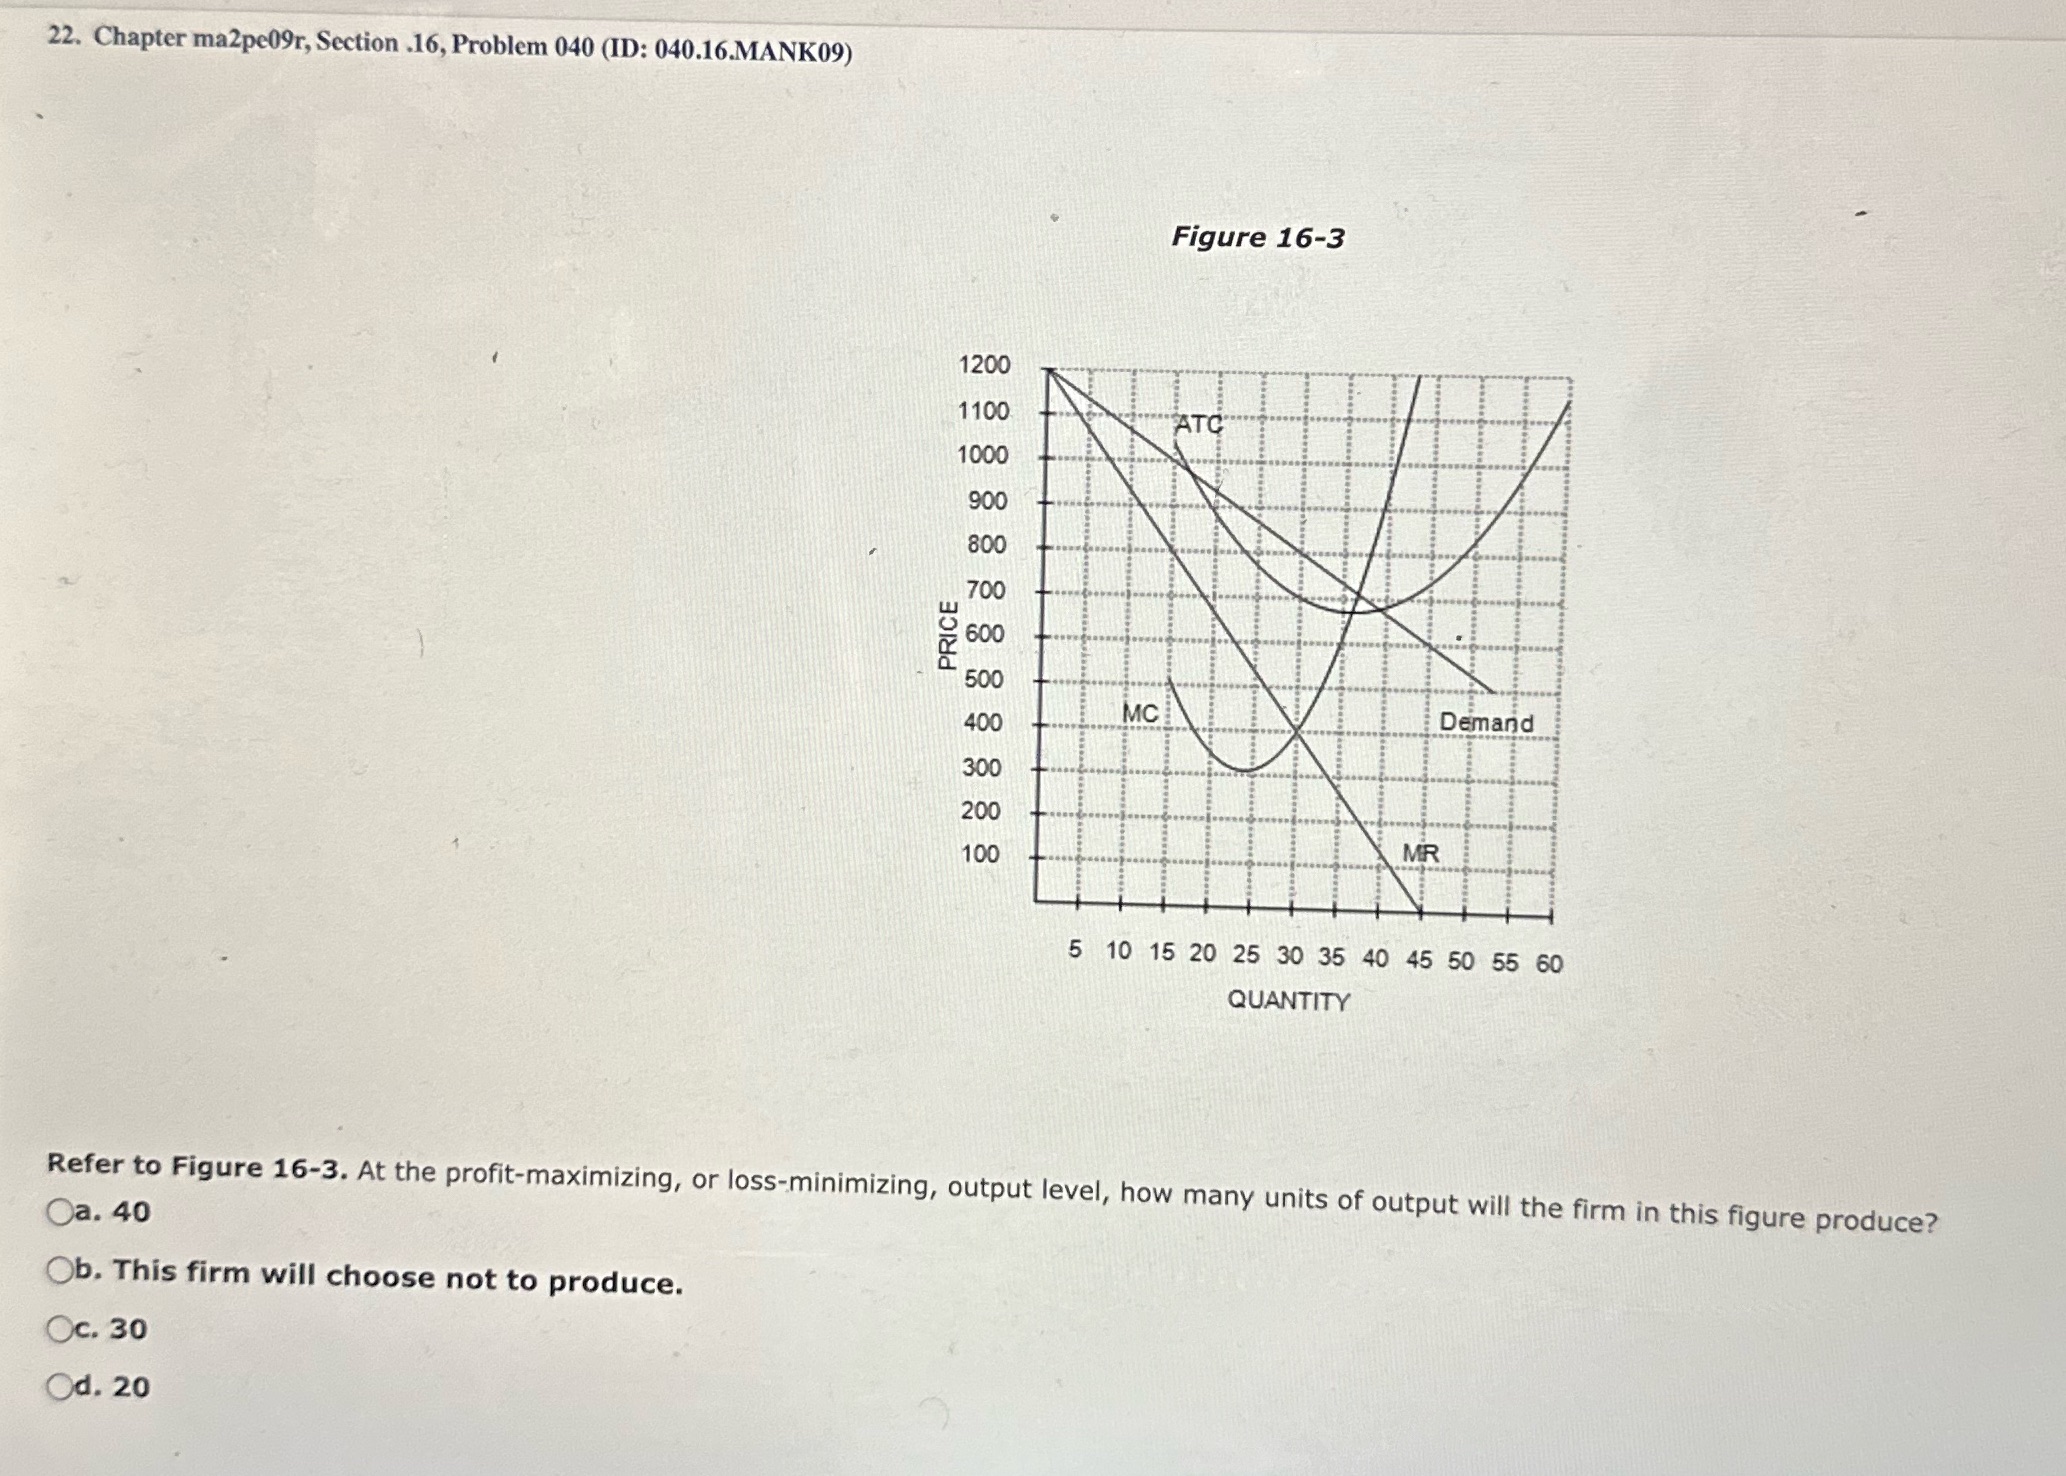
22. Chapter ma2pe09r, Section .16, Problem 040 (ID: 040.16.MANK09) Figure 16-3 1200 1100 1000 900 800 700 PRICE 600 500 400 Demand 300 200 100 MR 5 10 15 20 25 30 35 40 45 50 55 60 QUANTITY Refer to Figure 16-3. At the profit-maximizing, or loss-minimizing, output level, how many units of output will the firm in this figure produce? Oa. 40 Ob. This firm will choose not to produce. Oc. 30 Od. 20
Step by Step Solution
There are 3 Steps involved in it
1 Expert Approved Answer
Step: 1 Unlock

Question Has Been Solved by an Expert!
Get step-by-step solutions from verified subject matter experts
Step: 2 Unlock
Step: 3 Unlock