

Question: 22. Construct and interpret a u chart using the following data. Assume that the average size is two times the original product. Sample Defects 4
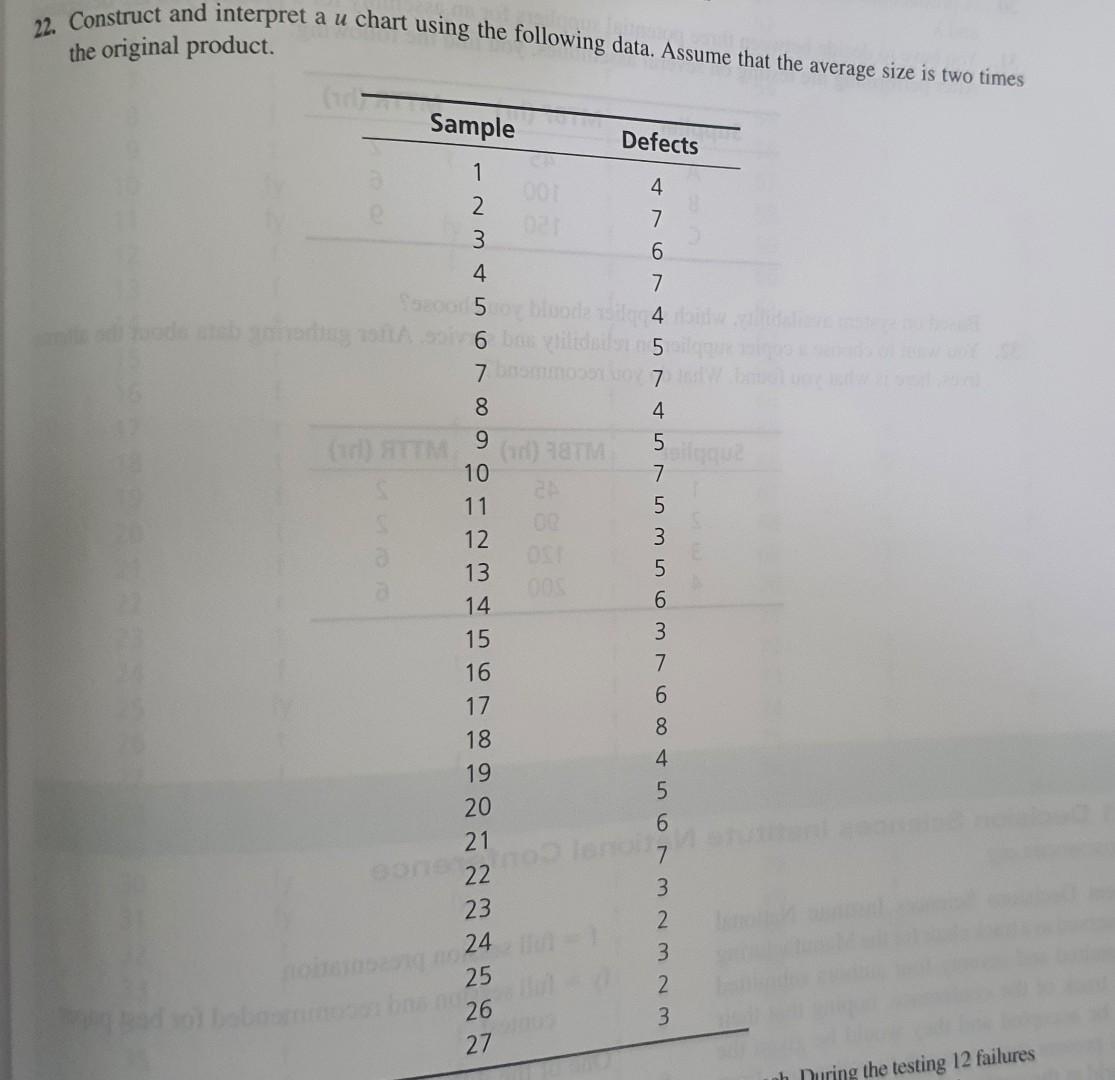
22. Construct and interpret a u chart using the following data. Assume that the average size is two times the original product. Sample Defects 4 2 3 6 4 7 4 5 7 5 3 7 8 9 10 11 12 13 14 15 16 17 18 19 20 21 22 23 24 25 26 27 5 6 3 7 6 8 4 5 6 3 2 3 3 During the testing 12 failures
Step by Step Solution
There are 3 Steps involved in it
1 Expert Approved Answer
Step: 1 Unlock

Question Has Been Solved by an Expert!
Get step-by-step solutions from verified subject matter experts
Step: 2 Unlock
Step: 3 Unlock