

Question: *22. The table available below shows three samples obtained independently from three populations. a. Conduct a one-way analysis of variance on the data. Use
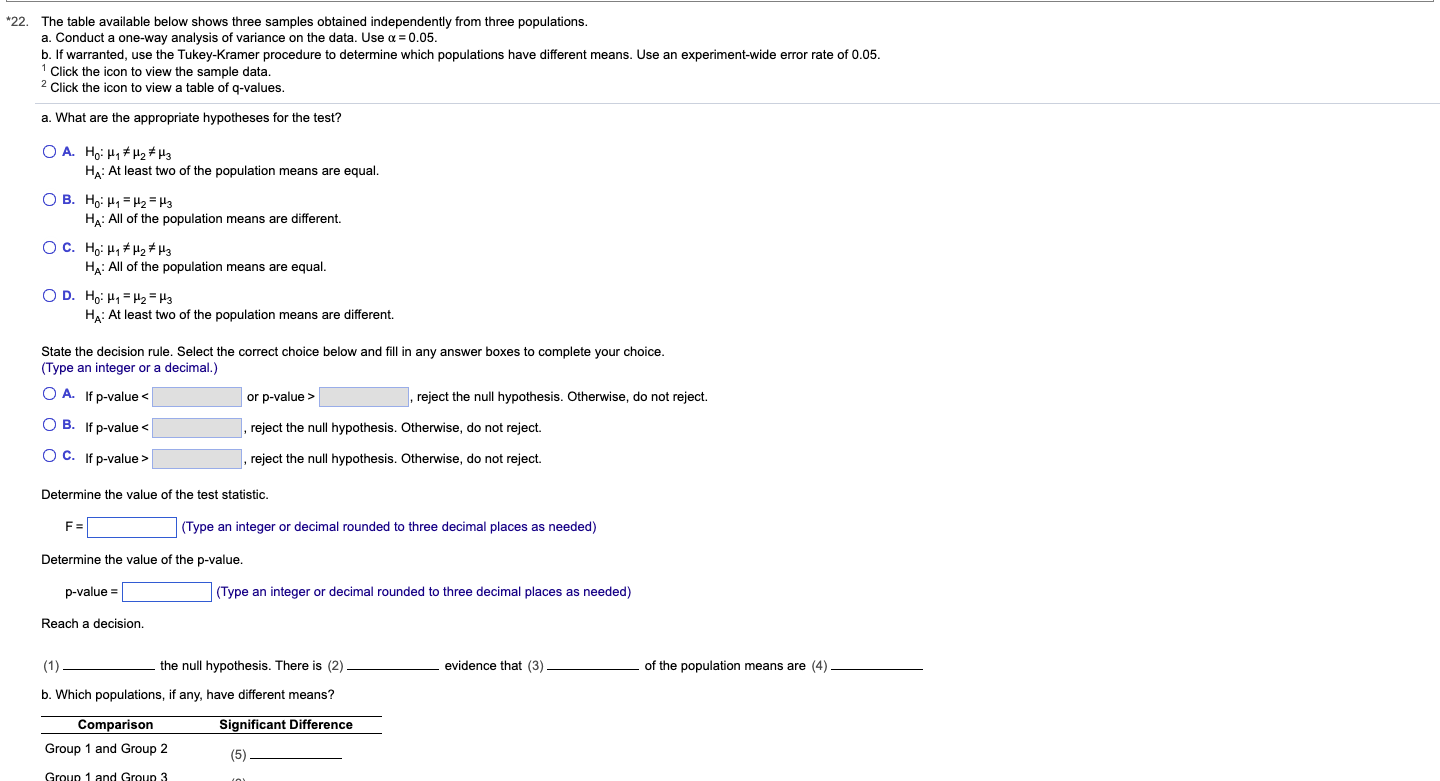
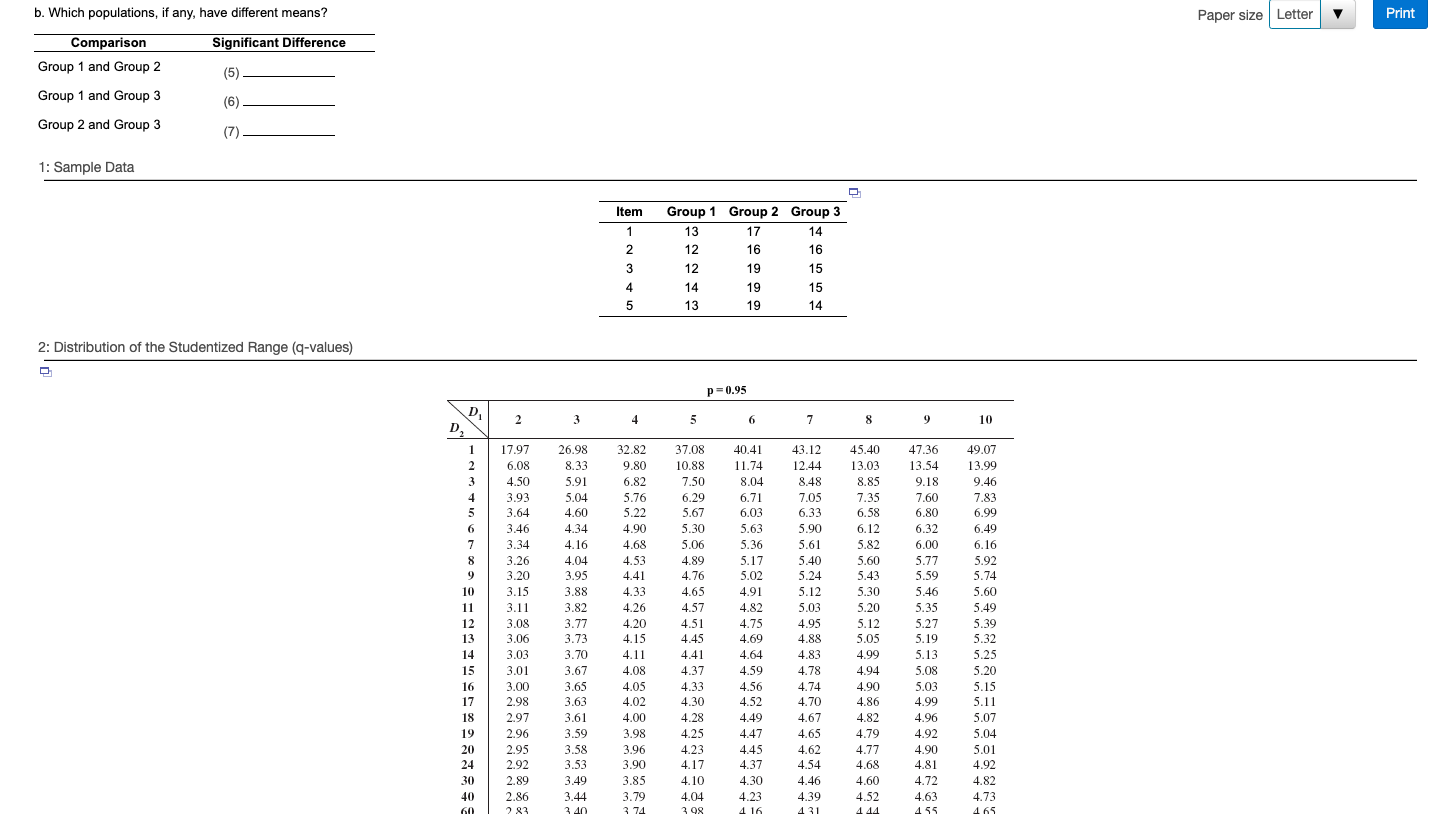
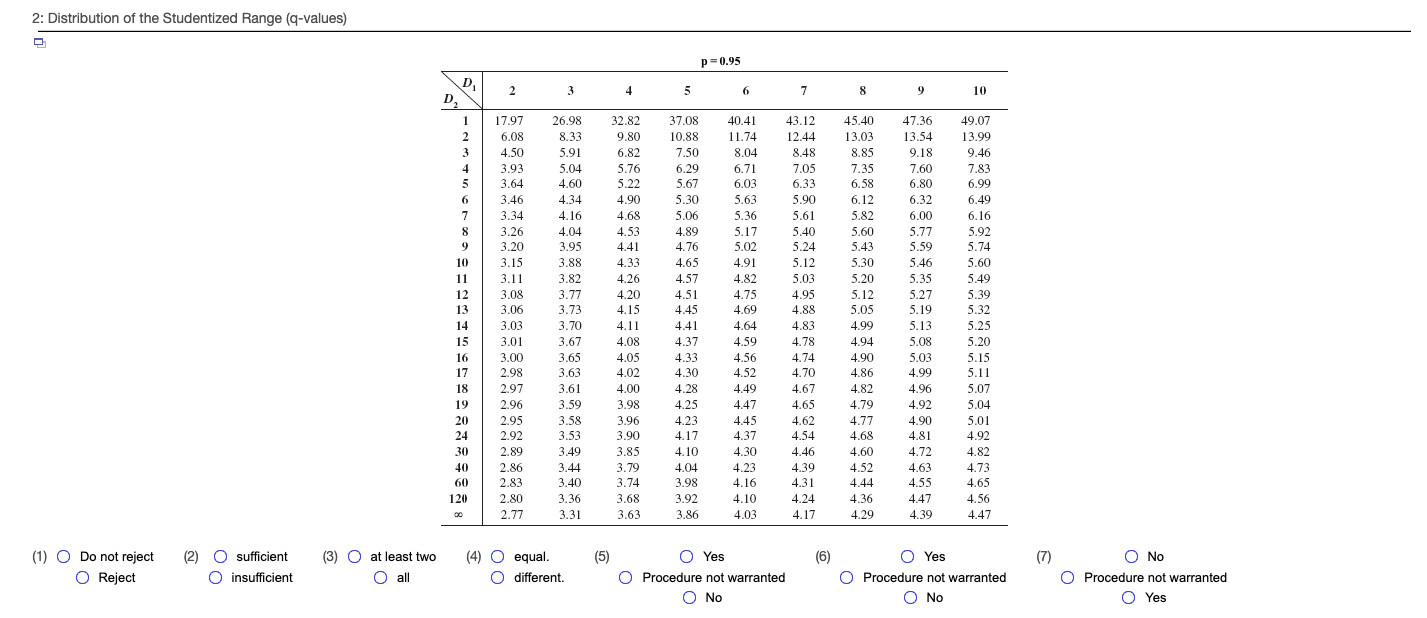
*22. The table available below shows three samples obtained independently from three populations. a. Conduct a one-way analysis of variance on the data. Use = 0.05. b. If warranted, use the Tukey-Kramer procedure to determine which populations have different means. Use an experiment-wide error rate of 0.05. 1 Click the icon to view the sample data. Click the icon to view a table of q-values. a. What are the appropriate hypotheses for the test? OA. Ho: H1 H2 H3 HA: At least two of the population means are equal. OB. Ho H =3 HA: All of the population means are different. OC. Ho HH2*H3 HA: All of the population means are equal. OD. Ho H =3 HA: At least two of the population means are different. State the decision rule. Select the correct choice below and fill in any answer boxes to complete your choice. (Type an integer or a decimal.) OA. If p-value < or p-value> reject the null hypothesis. Otherwise, do not reject. , reject the null hypothesis. Otherwise, do not reject. , reject the null hypothesis. Otherwise, do not reject. B. If p-value < OC. If p-value> Determine the value of the test statistic. F= (Type an integer or decimal rounded to three decimal places as needed) Determine the value of the p-value. p-value= Reach a decision. (1). (Type an integer or decimal rounded to three decimal places as needed) the null hypothesis. There is (2) evidence that (3) of the population means are (4) b. Which populations, if any, have different means? Comparison Group 1 and Group 2 Significant Difference (5). Group 1 and Group 3 b. Which populations, if any, have different means? Significant Difference Comparison Group 1 and Group 2 (5) Group 1 and Group 3 (6) Group 2 and Group 3 1: Sample Data 2: Distribution of the Studentized Range (q-values) Item Group 1 Group 2 Group 3 1 13 17 14 2 12 16 16 3 12 19 15 4 14 19 15 5 13 19 14 p=0.95 D 21 3 4 5 6 7 8 9 10 D 1 17.97 26.98 32.82 37.08 40.41 43.12 45.40 47.36 49.07 2 6.08 8.33 9.80 10.88 11.74 12.44 13.03 13.54 13.99 3 4.50 5.91 6.82 7.50 8.04 8.48 8.85 9.18 9.46 4 3.93 5.04 5.76 6.29 6.71 7.05 7.35 7.60 7.83 5 3.64 4.60 5.22 5.67 6.03 6.33 6.58 6.80 6.99 6 3.46 4.34 4.90 5.30 5.63 5.90 6.12 6.32 6.49 7 3.34 4.16 4.68 5.06 5.36 5.61 5.82 6.00 6.16 8 3.26 4.04 4.53 4.89 5.17 5.40 5.60 5.77 5.92 9 3.20 3.95 4.41 4.76 5.02 5.24 5.43 5.59 5.74 10 3.15 3.88 4.33 4.65 4.91 5.12 5.30 5.46 5.60 11 3.11 3.82 4.26 4.57 4.82 5.03 5.20 5.35 5.49 12 3.08 3.77 4.20 4.51 4.75 4.95 5.12 5.27 5.39 13 3.06 3.73 4.15 4.45 4.69 4.88 5.05 5.19 5.32 14 3.03 3.70 4.11 4.41 4.64 4.83 4.99 5.13 5.25 15 3.01 3.67 4.08 4.37 4.59 4.78 4.94 5.08 5.20 16 3.00 3.65 4.05 4.33 4.56 4.74 4.90 5.03 5.15 17 2.98 3.63 4.02 4.30 4.52 4.70 4.86 4.99 5.11 18 2.97 3.61 4.00 4.28 4.49 4.67 4.82 4.96 5.07 19 2.96 3.59 3.98 4.25 4.47 4.65 4.79 4.92 5.04 20 2.95 3.58 3.96 4.23 4.45 4.62 4.77 4.90 5.01 24 2.92 3.53 3.90 4.17 4.37 4.54 4.68 4.81 4.92 30 2.89 3.49 3.85 4.10 4.30 4.46 4.60 4.72 4.82 40 2.86 3.44 3.79 4.04 4.23 4.39 4.52 4.63 4.73 60 283 3.40 3.74 3.98 416 431 4 44 455 4.65 Paper size Letter Print 2: Distribution of the Studentized Range (q-values) (1) Do not reject Reject p=0.95 D 2 3 4 5 6 7 8 9 10 D 1 17.97 26.98 32.82 37.08 40.41 43.12 45.40 47.36 49.07 2 6.08 8.33 9.80 10.88 11.74 12.44 13.03 13.54 13.99 3 4.50 5.91 6.82 7.50 8.04 8.48 8.85 9.18 9.46 4 3.93 5.04 5.76 6.29 6.71 7.05 7.35 7.60 7.83 5 3.64 4.60 5.22 5.67 6.03 6.33 6.58 6.80 6.99 6 3.46 4.34 4.90 5.30 5.63 5.90 6.12 6.32 6.49 7 3.34 4.16 4.68 5.06 5.36 5.61 5.82 6.00 6.16 8 3.26 4.04 4.53 4.89 5.17 5.40 5.60 5.77 5.92 9 3.20 3.95 4.41 4.76 5.02 5.24 5.43 5.59 5.74 10 3.15 3.88 4.33 4.65 4.91 5.12 5.30 5.46 5.60 3.11 3.82 4.26 4.57 4.82 5.03 5.20 5.35 5.49 3.08 3.77 4.20 4.51 4.75 4.95 5.12 5.27 5.39 13 3.06 3.73 4.15 4.45 4.69 4.88 5.05 5.19 5.32 14 3.03 3.70 4.11 4.41 4.64 4.83 4.99 5.13 5.25 15 3.01 3.67 4.08 4.37 4.59 4.78 4.94 5.08 5.20 16 3.00 3.65 4.05 4.33 4.56 4.74 4.90 5.03 5.15 17 2.98 3.63 4.02 4.30 4.52 4.70 4.86 4.99 5.11 18 2.97 3.61 4.00 4.28 4.49 4.67 4.82 4.96 5.07 19 2.96 3.59 3.98 4.25 4.47 4.65 4.79 4.92 5.04 20 2.95 3.58 3.96 4.23 4.45 4.62 4.77 4.90 5.01 24 2.92 3.53 3.90 4.17 4.37 4.54 4.68 4.81 4.92 30 2.89 3.49 3.85 4.10 4.30 4.46 4.60 4.72 4.82 40 2.86 3.44 3.79 4.04 4.23 4.39 4.52 4.63 4.73 60 2.83 3.40 3.74 3.98 4.16 4.31 4.44 4.55 4.65 120 2.80 3.36 3.68 3.92 4.10 4.24 4.36 4.47 4.56 00 2.77 3.31 3.63 3.86 4.03 4.17 4.29 4.39 4.47 Yes (6) Yes (2) 00 sufficient (3) at least two (4) equal. (5) insufficient all different. Procedure not warranted No Procedure not warranted No (7) No Procedure not warranted Yes
Step by Step Solution
There are 3 Steps involved in it

Get step-by-step solutions from verified subject matter experts