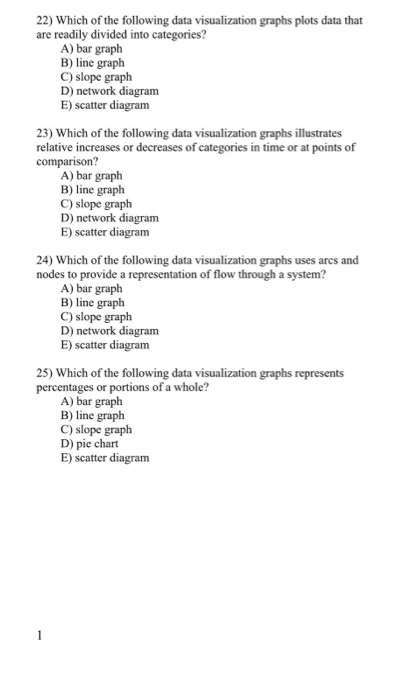
Question: 22) Which of the following data visualization graphs plots data that are readily divided into categories? A) bar graph B) line graph C) slope graph

22) Which of the following data visualization
22) Which of the following data visualization graphs plots data that are readily divided into categories? A) bar graph B) line graph C) slope graph D) network diagram E) scatter diagram 23) Which of the following data visualization graphs illustrates relative increases or decreases of categories in time or at points of comparison? A) bar graph B) line graph C) slope graph D) network diagram E) scatter diagram 24) Which of the following data visualization graphs uses arcs and nodes to provide a representation of flow through a system? A) bar graph B) line graph C) slope graph D) network diagram E) scatter diagram 25) Which of the following data visualization graphs represents percentages or portions of a whole? A) bar graph B) line graph C) slope graph D) pie chart E) scatter diagram

Step by Step Solution

There are 3 Steps involved in it

1 Expert Approved Answer
Step: 1 Unlock blur-text-image
Question Has Been Solved by an Expert!

Get step-by-step solutions from verified subject matter experts

Step: 2 Unlock
Step: 3 Unlock

Students Have Also Explored These Related General Management Questions!