

Question: 22:11 Sun Nov 19 7% https://comm all MATH 2B Dash X T Zotcourse - Sc X D Mathway | Calc X Homework (Ch X /
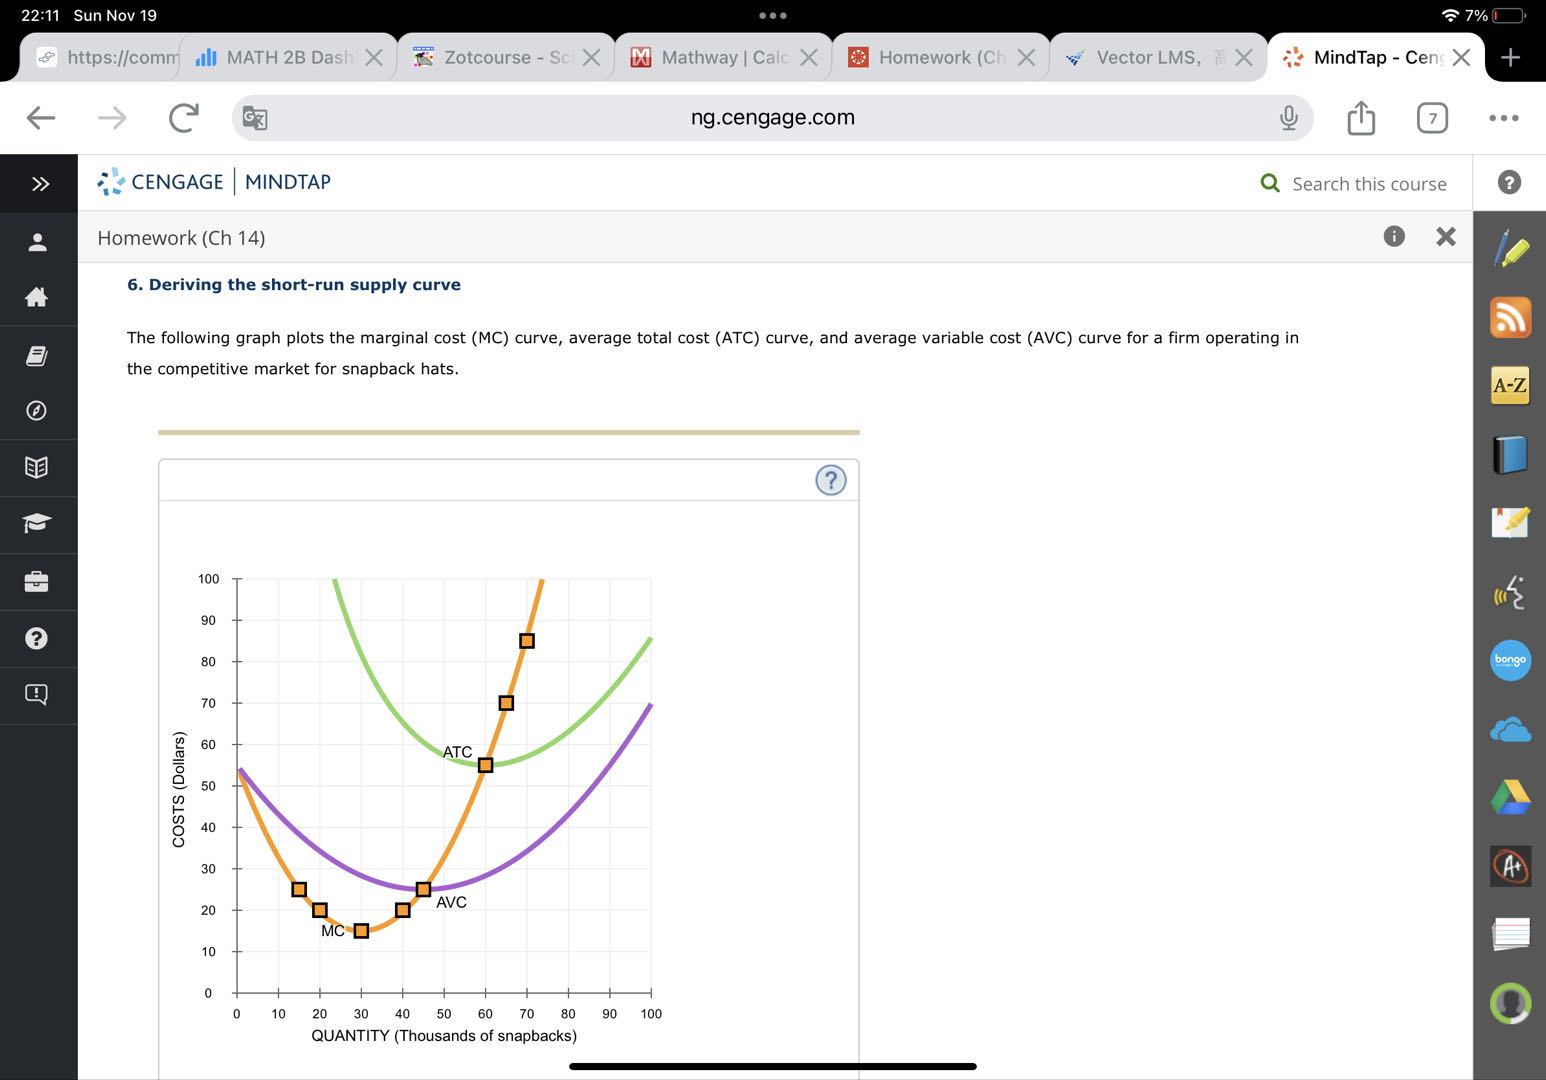
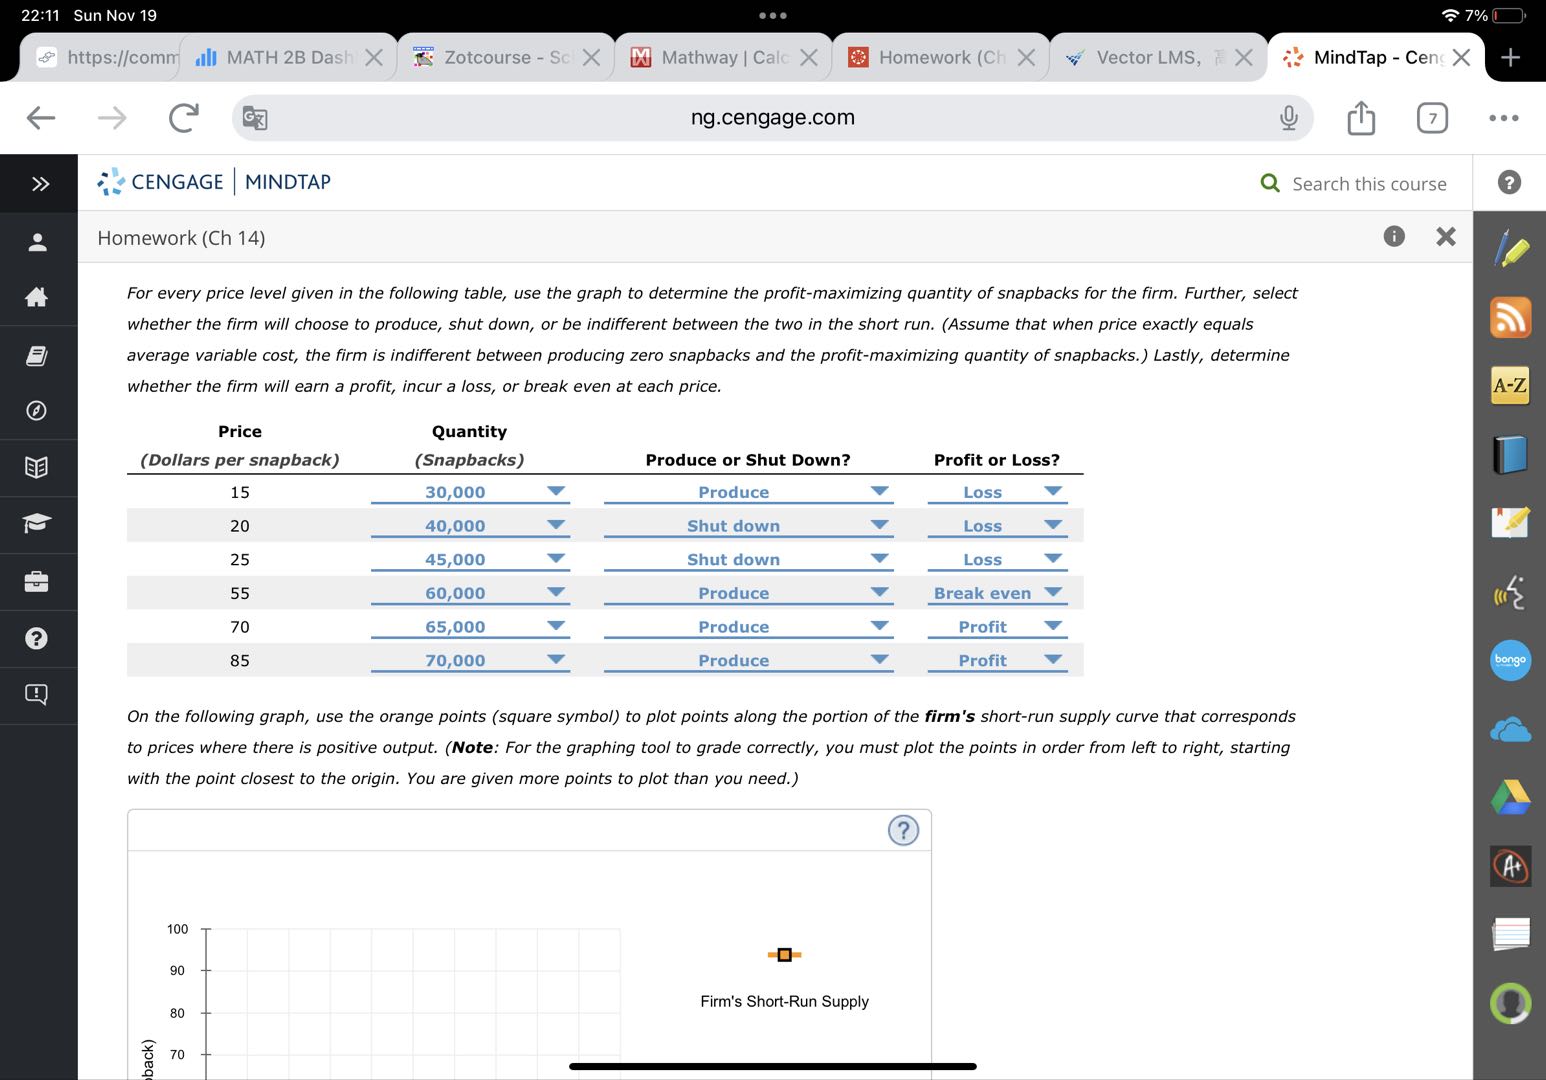
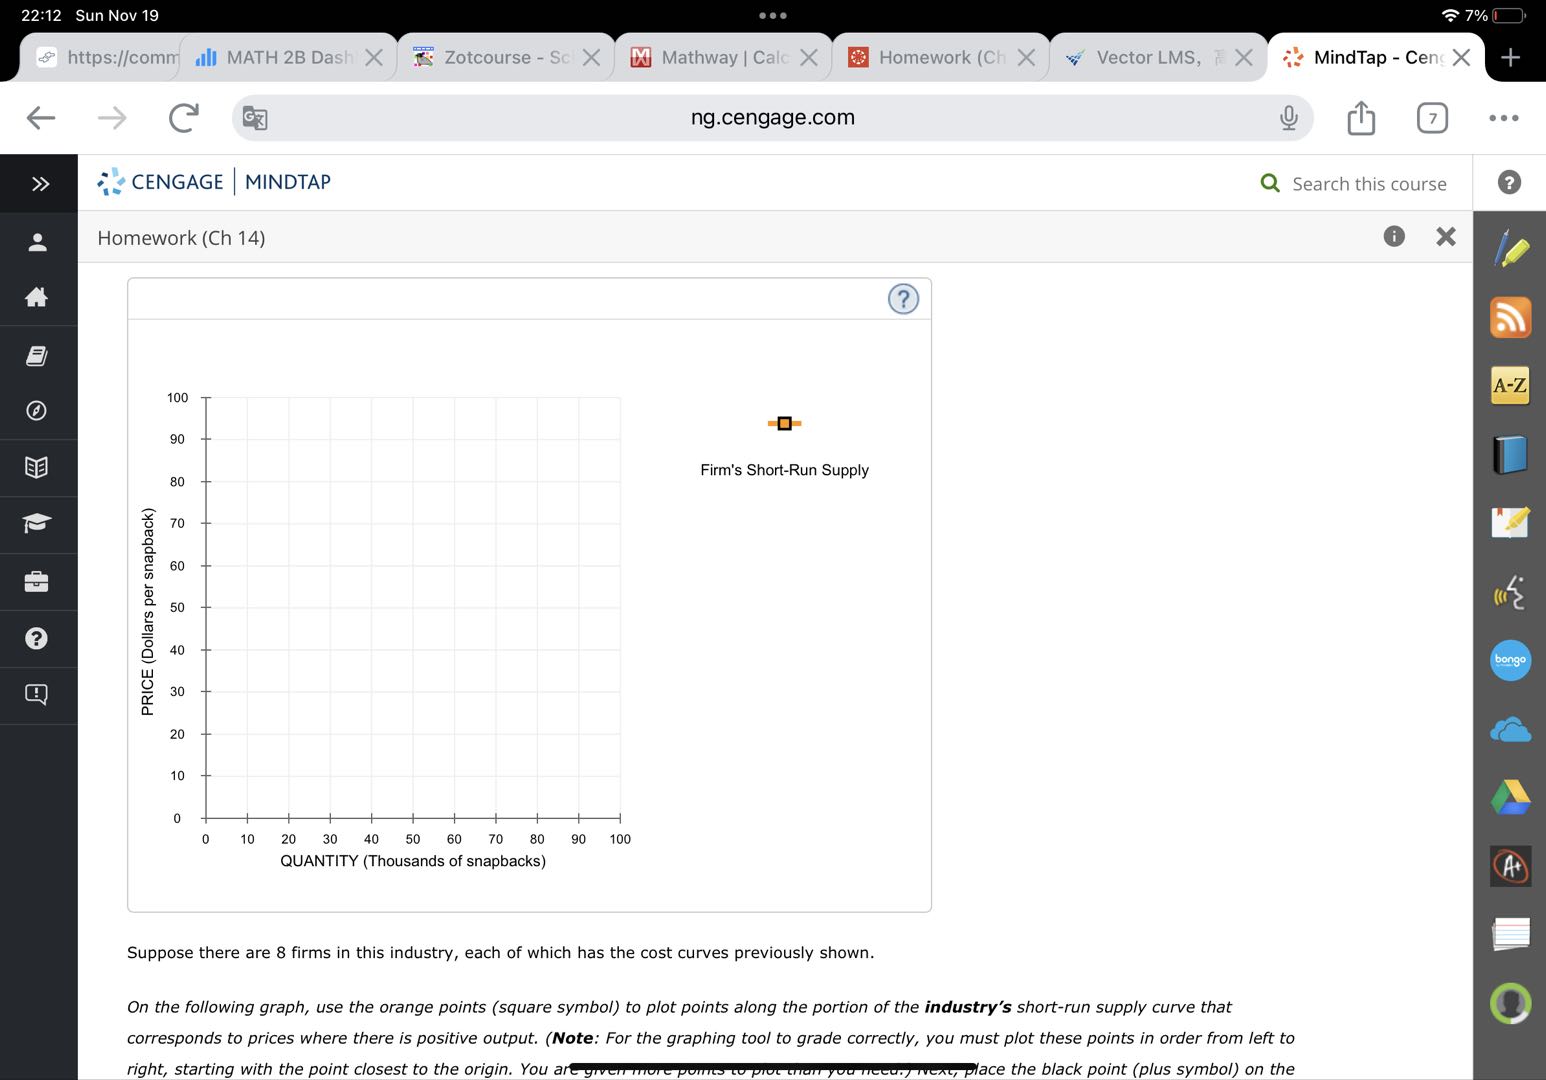
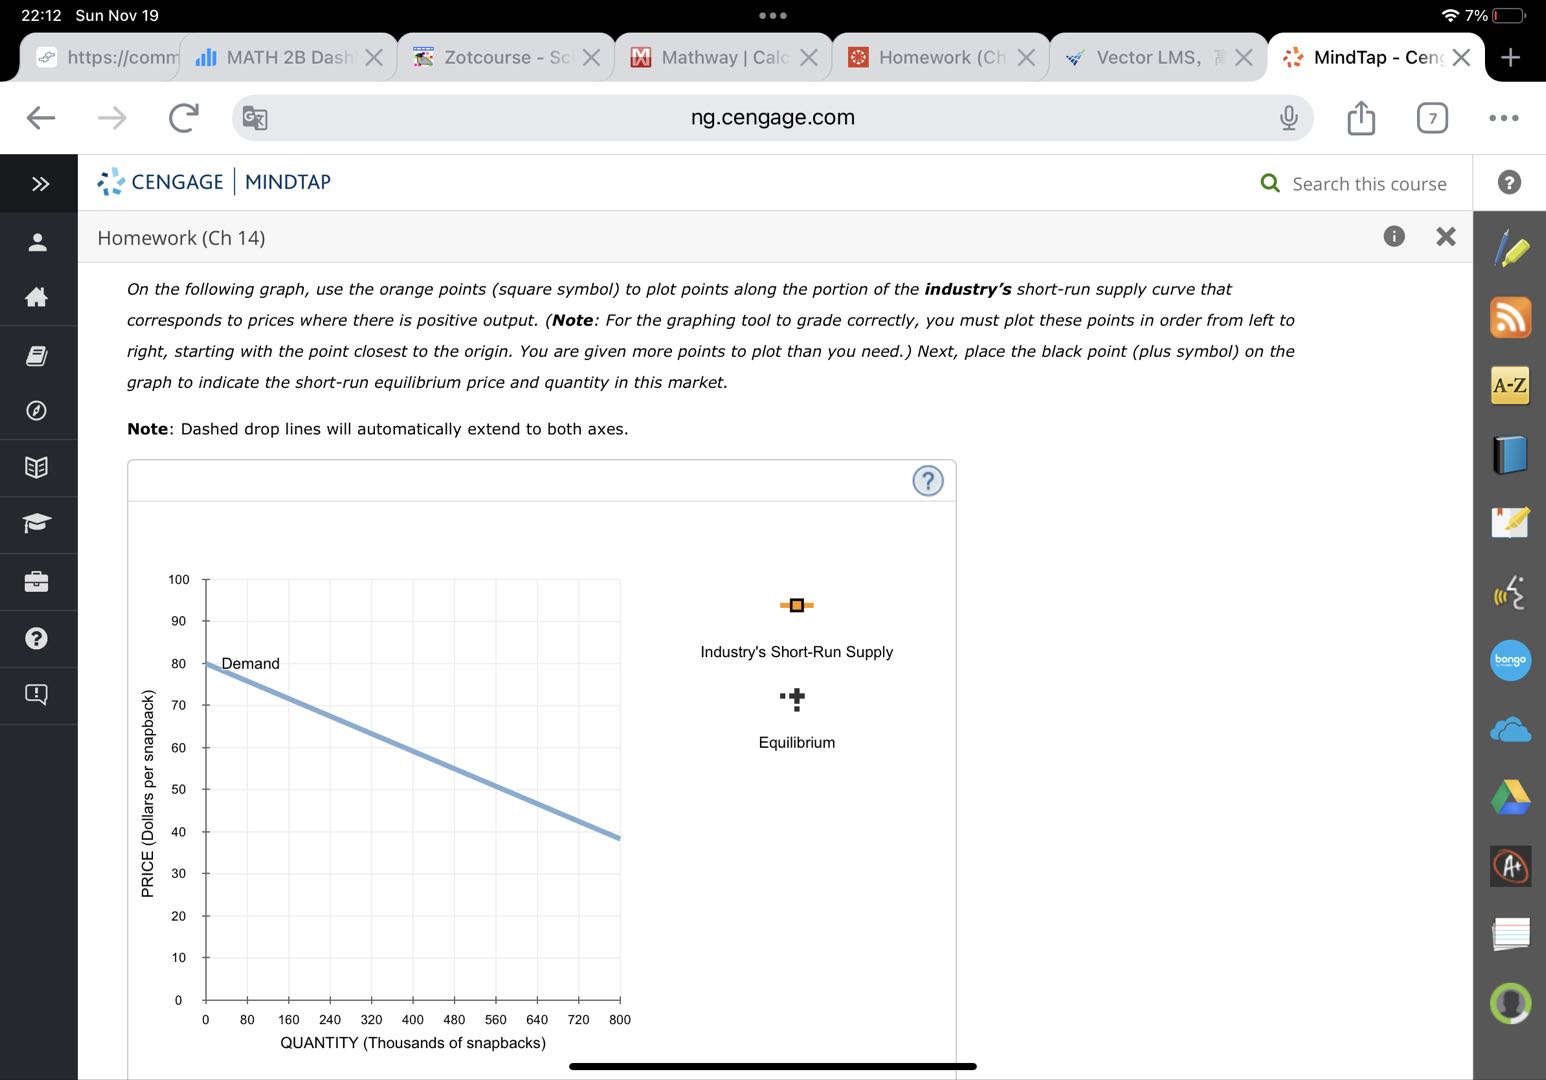
22:11 Sun Nov 19 7% https://comm all MATH 2B Dash X T Zotcourse - Sc X D Mathway | Calc X Homework (Ch X / Vector LMS, F X MindTap - Cens X IF GZ ng.cengage.com 7 CENGAGE |MINDTAP Q Search this course ? Homework (Ch 14) O X 6. Deriving the short-run supply curve The following graph plots the marginal cost (MC) curve, average total cost (ATC) curve, and average variable cost (AVC) curve for a firm operating in the competitive market for snapback hats. A-2 (? 100 90 ? 80 bongo 70 60 ATC 50 COSTS (Dollars) 40 30 A+ AVC 20 MC O 10 10 20 30 40 50 60 70 80 90 100 O QUANTITY (Thousands of snapbacks)e @lnl we a 9 G httpsjlcomn (3' e1 5.. CENGAGE | MINDTAP Homework (Ch 14) For every price level given in the following table, use the graph to determine the prot-maximizing quantity of snapbacks for the rm. Further, select whether the firm will choose to produce, shut down, or be indifferent between the two in the short run. (Assume that when price exactly equais average variable cost, the firm is indifferent between producing zero snapbacks and the profit-maximizing quantity ofsnapbacksj Lastly, determine all MATH 23 0. K Zotcourse ' Mathway \\ C. ';
Step by Step Solution
There are 3 Steps involved in it

Get step-by-step solutions from verified subject matter experts