

Question: .23 Demand for a given product has been tracked for 5 years, and the results are shown below: a. Use the first 4 years of
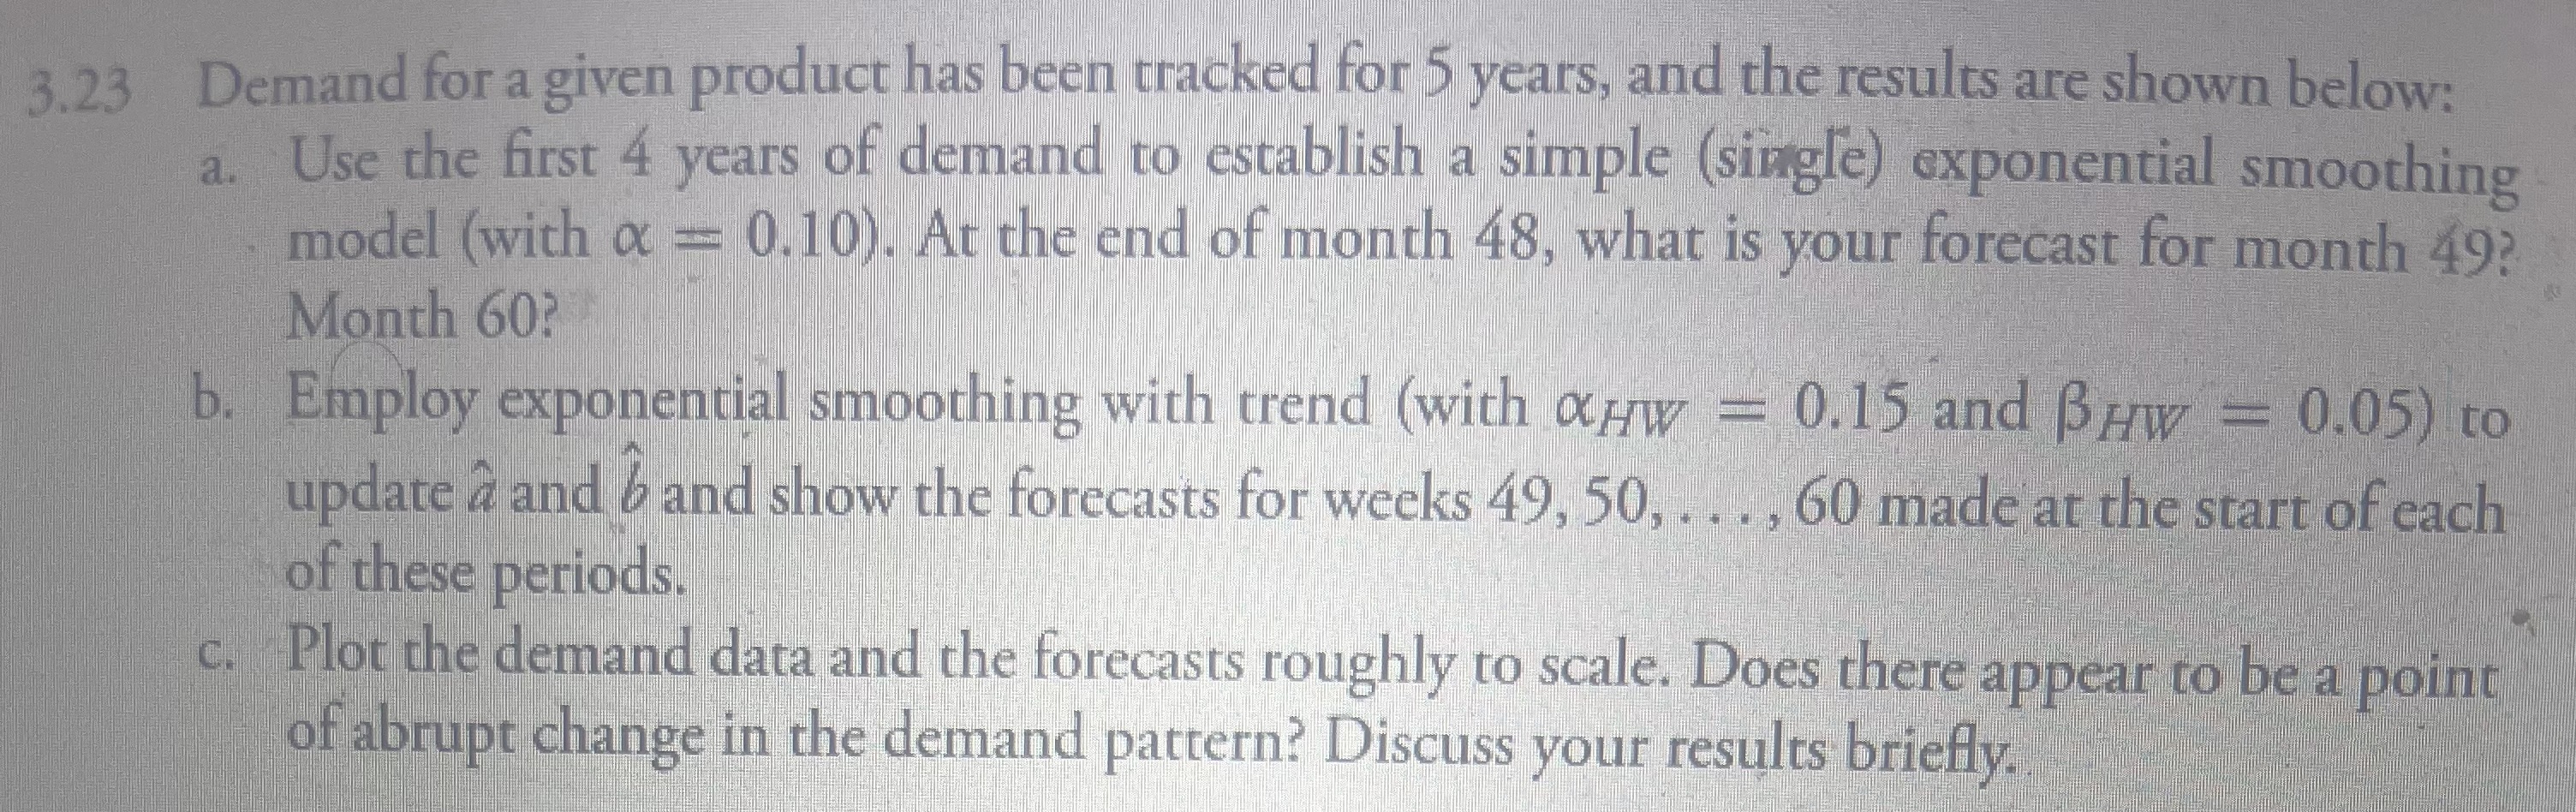
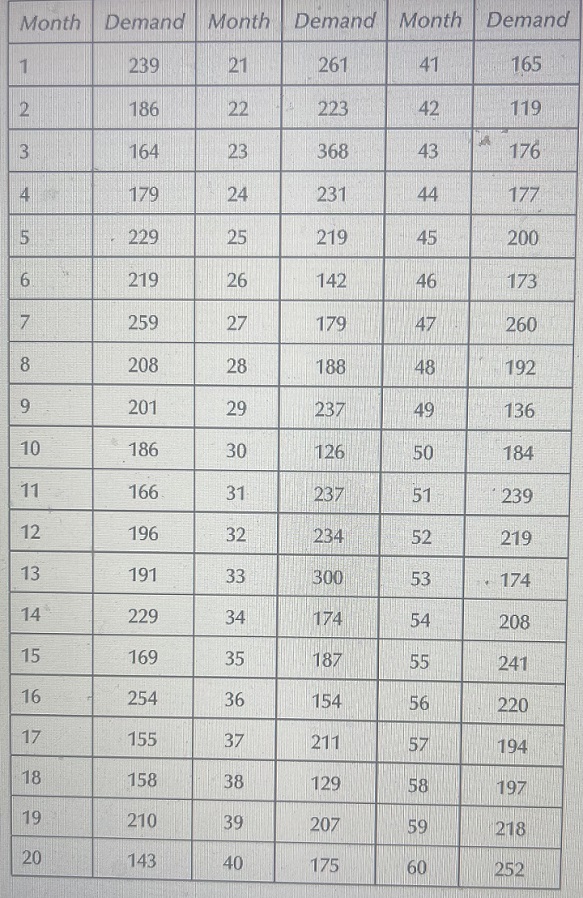
.23 Demand for a given product has been tracked for 5 years, and the results are shown below: a. Use the first 4 years of demand to establish a simple (single) exponential smoothing model (with =0.10 ). At the end of month 48 , what is your forecast for month 49 ? Month 60? b. Employ exponential smoothing with trend (with HW=0.15 and HW=0.05 ) to update a^ and b^ and show the forecasts for weeks 49,50,,60 made at the start of each of these periods. c. Plot the demand data and the forecasts roughly to scale. Does there appear to be a point of abrupt change in the demand pattern? Discuss your results briefly. \begin{tabular}{|l|c|c|c|c|c|} \hline Month & Demand & Month & Demand & Month & Demand \\ \hline 1 & 239 & 21 & 261 & 41 & 165 \\ \hline 2 & 186 & 22 & 223 & 42 & 119 \\ \hline 3 & 164 & 23 & 368 & 43 & 176 \\ \hline 4 & 179 & 24 & 231 & 44 & 177 \\ \hline 5 & 229 & 25 & 219 & 45 & 200 \\ \hline 6 & 219 & 26 & 142 & 46 & 173 \\ \hline 7 & 259 & 27 & 179 & 47 & 260 \\ \hline 8 & 208 & 28 & 188 & 48 & 192 \\ \hline 9 & 201 & 29 & 237 & 49 & 136 \\ \hline 10 & 186 & 30 & 126 & 50 & 184 \\ \hline 11 & 166 & 31 & 237 & 51 & 239 \\ \hline 12 & 196 & 32 & 234 & 52 & 219 \\ \hline 13 & 191 & 33 & 300 & 53 & 174 \\ \hline 14 & 229 & 34 & 174 & 54 & 208 \\ \hline 15 & 169 & 35 & 187 & 55 & 241 \\ \hline 16 & 254 & 36 & 154 & 56 & 220 \\ \hline 17 & 155 & 37 & 211 & 57 & 194 \\ \hline 18 & 158 & 38 & 129 & 58 & 197 \\ \hline 19 & 210 & 39 & 207 & 59 & 218 \\ \hline 20 & 143 & 40 & 175 & 60 & 252 \\ \hline \end{tabular}
Step by Step Solution
There are 3 Steps involved in it

Get step-by-step solutions from verified subject matter experts