

Question: 2.3 Do the following computation and plotting (8pt){} 1. Plot the density function of N(,2) with the x-axis ranging in xrange (an input argument) 2.
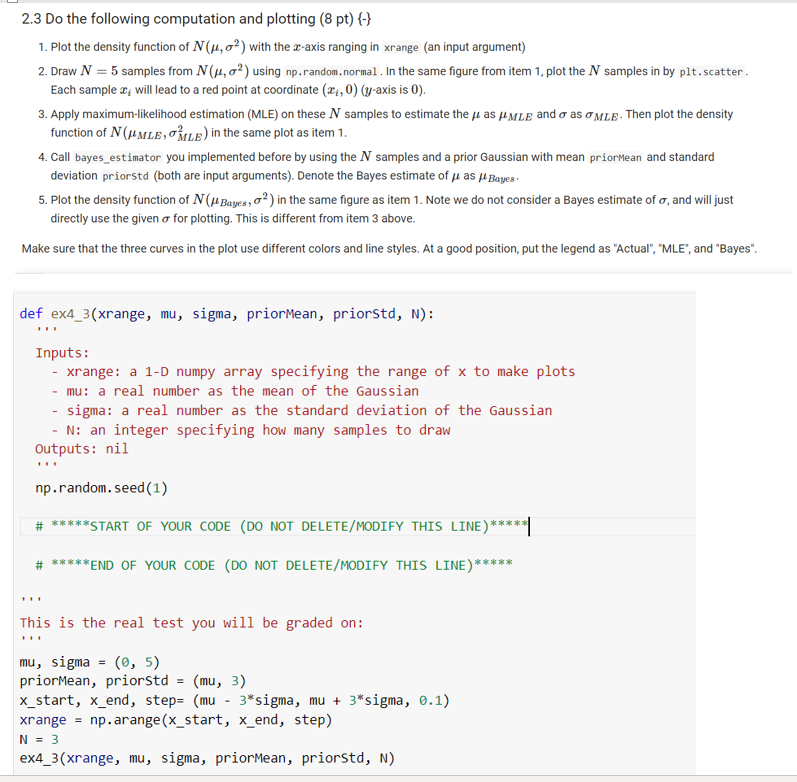
2.3 Do the following computation and plotting (8pt){} 1. Plot the density function of N(,2) with the x-axis ranging in xrange (an input argument) 2. Draw N=5 samples from N(,2) using np. random. normal . In the same figure from item 1, plot the N samples in by plt. scatter . Each sample xi will lead to a red point at coordinate (xi,0)(y-axis is 0). 3. Apply maximum-likelihood estimation (MLE) on these N samples to estimate the as MLE and as MLE. Then plot the density function of N(MLE,MLE2) in the same plot as item 1. 4. Call bayes_estimator you implemented before by using the N samples and a prior Gaussian with mean priormean and standard deviation priorstd (both are input arguments). Denote the Bayes estimate of as Bayes. 5. Plot the density function of N(Bayes,2) in the same figure as item 1. Note we do not consider a Bayes estimate of , and will just directly use the given for plotting. This is different from item 3 above. Make sure that the three curves in the plot use different colors and line styles. At a good position, put the legend as "Actual", "MLE", and "Bayes
Step by Step Solution
There are 3 Steps involved in it

Get step-by-step solutions from verified subject matter experts