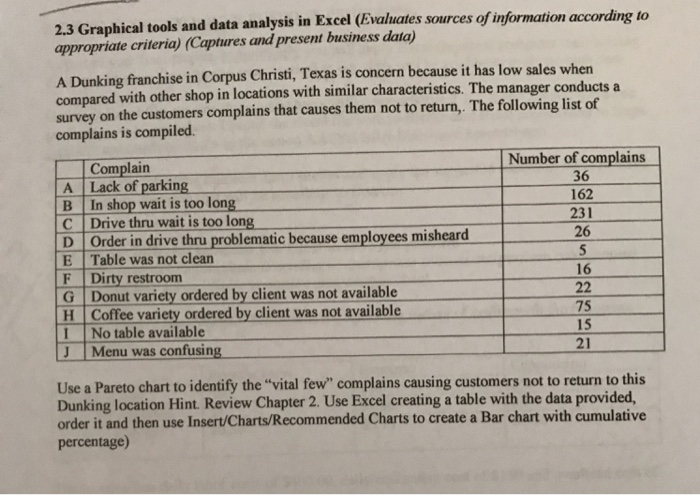
Question: 2.3 Graphical tools and data analysis in Excel (Evaluates sources of information according to appropriate criteria) (Captures and present business data) A Dunking franchise in

2.3 Graphical tools and data analysis in Excel
2.3 Graphical tools and data analysis in Excel (Evaluates sources of information according to appropriate criteria) (Captures and present business data) A Dunking franchise in Corpus Christi, Texas is concern because it has low sales when compared with other shop in locations with similar characteristics. The manager conducts a survey on the customers complains that causes them not to return. The following list of complains is compiled. Number of complains 36 162 231 A B C D E F G Complain Lack of parking In shop wait is too long Drive thru wait is too long Order in drive thru problematic because employees misheard Table was not clean Dirty restroom Donut variety ordered by client was not available Coffee variety ordered by client was not available No table available Menu was confusing H I J Use a Pareto chart to identify the "vital few" complains causing customers not to return to this Dunking location Hint. Review Chapter 2. Use Excel creating a table with the data provided, order it and then use Insert/Charts/Recommended Charts to create a Bar chart with cumulative percentage)

Step by Step Solution

There are 3 Steps involved in it

1 Expert Approved Answer
Step: 1 Unlock blur-text-image
Question Has Been Solved by an Expert!

Get step-by-step solutions from verified subject matter experts

Step: 2 Unlock
Step: 3 Unlock

Students Have Also Explored These Related General Management Questions!