

Question: 23 II 11pt Application Font Ex-10 Function-Gen-with-Filter.vi Front Panel * Cut-off Frequency 10 Frequency (Hz) Noise Amplitude Original Signal Graph 5- 3 Amplitude (V)
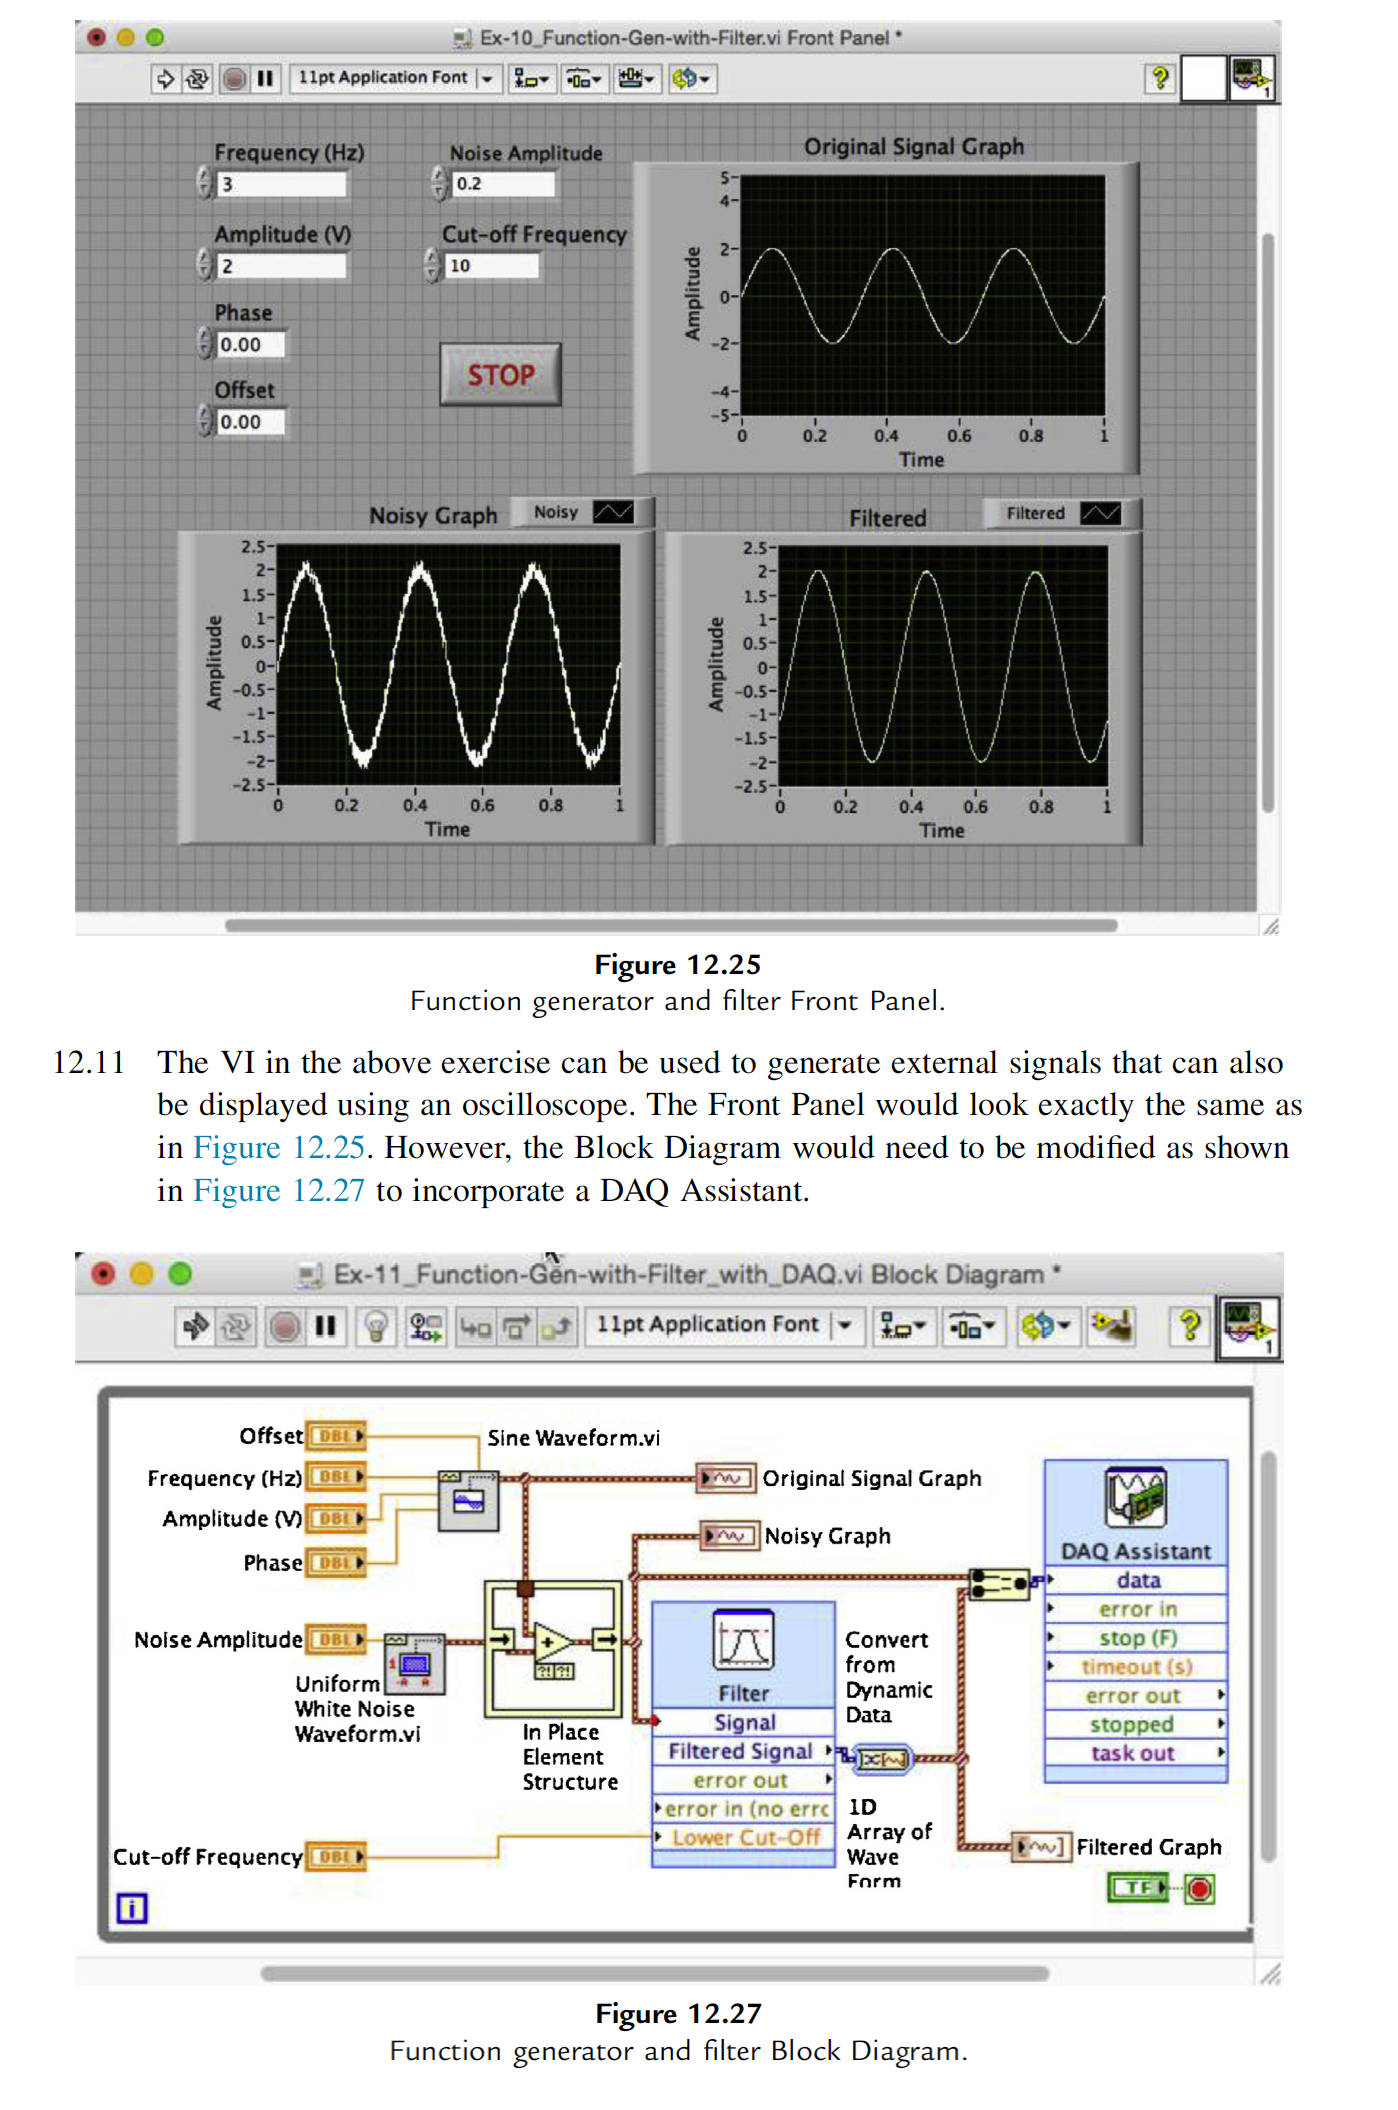
23 II 11pt Application Font Ex-10 Function-Gen-with-Filter.vi Front Panel * Cut-off Frequency 10 Frequency (Hz) Noise Amplitude Original Signal Graph 5- 3 Amplitude (V) 2 0.2 4- Phase Amplitude 2- 0- 0.00 STOP Offset 0.00 -4- 0 0.2 0.4 0.6 0.8 Time Noisy Graph Noisy Filtered Filtered N Amplitude -2- 2.5- 2- 1.5- 1- 0.5- 0-1 -0.5- -1- -1.5- 2.5-1 2- 1.5- Amplitude 1- 0.5- 0- -0.5- -1- -1.5- -2- -2.5- 0 -2.5- 0.2 0.4 0.6 0.8 0 0.2 0.4 0.6 0.8 Time Time Figure 12.25 Function generator and filter Front Panel. 12.11 The VI in the above exercise can be used to generate external signals that can also be displayed using an oscilloscope. The Front Panel would look exactly the same as in Figure 12.25. However, the Block Diagram would need to be modified as shown in Figure 12.27 to incorporate a DAQ Assistant. Ex-11 Function-Gen-with-Filter_with_DAQ.vi Block Diagram * 401 11pt Application Font Offset DBL Sine Waveform.vi Frequency (Hz) DBL Amplitude (V) DBE Phase DBL Noise Amplitude DBL Uniform White Noise Waveform.vi Cut-off Frequency DBL 28 29 Original Signal Graph w Noisy Graph Filter Signal Filtered Signal Convert from Dynamic Data DAQ Assistant data error in stop (F) timeout(s) error out stopped task out In Place Element Structure error out error in (no errc Lower Cut-Off ID Array of Wave F]Filtered Graph Form TEO Figure 12.27 Function generator and filter Block Diagram.
Step by Step Solution
There are 3 Steps involved in it

Get step-by-step solutions from verified subject matter experts