

Question: 2.3 More Graphs for Quantitati A ALEKS - Robert Johns - 2.3 Mor x C A G 2,3,3,4,4 Canvas Dashboard Prince George's Co... PGCC EMAIL
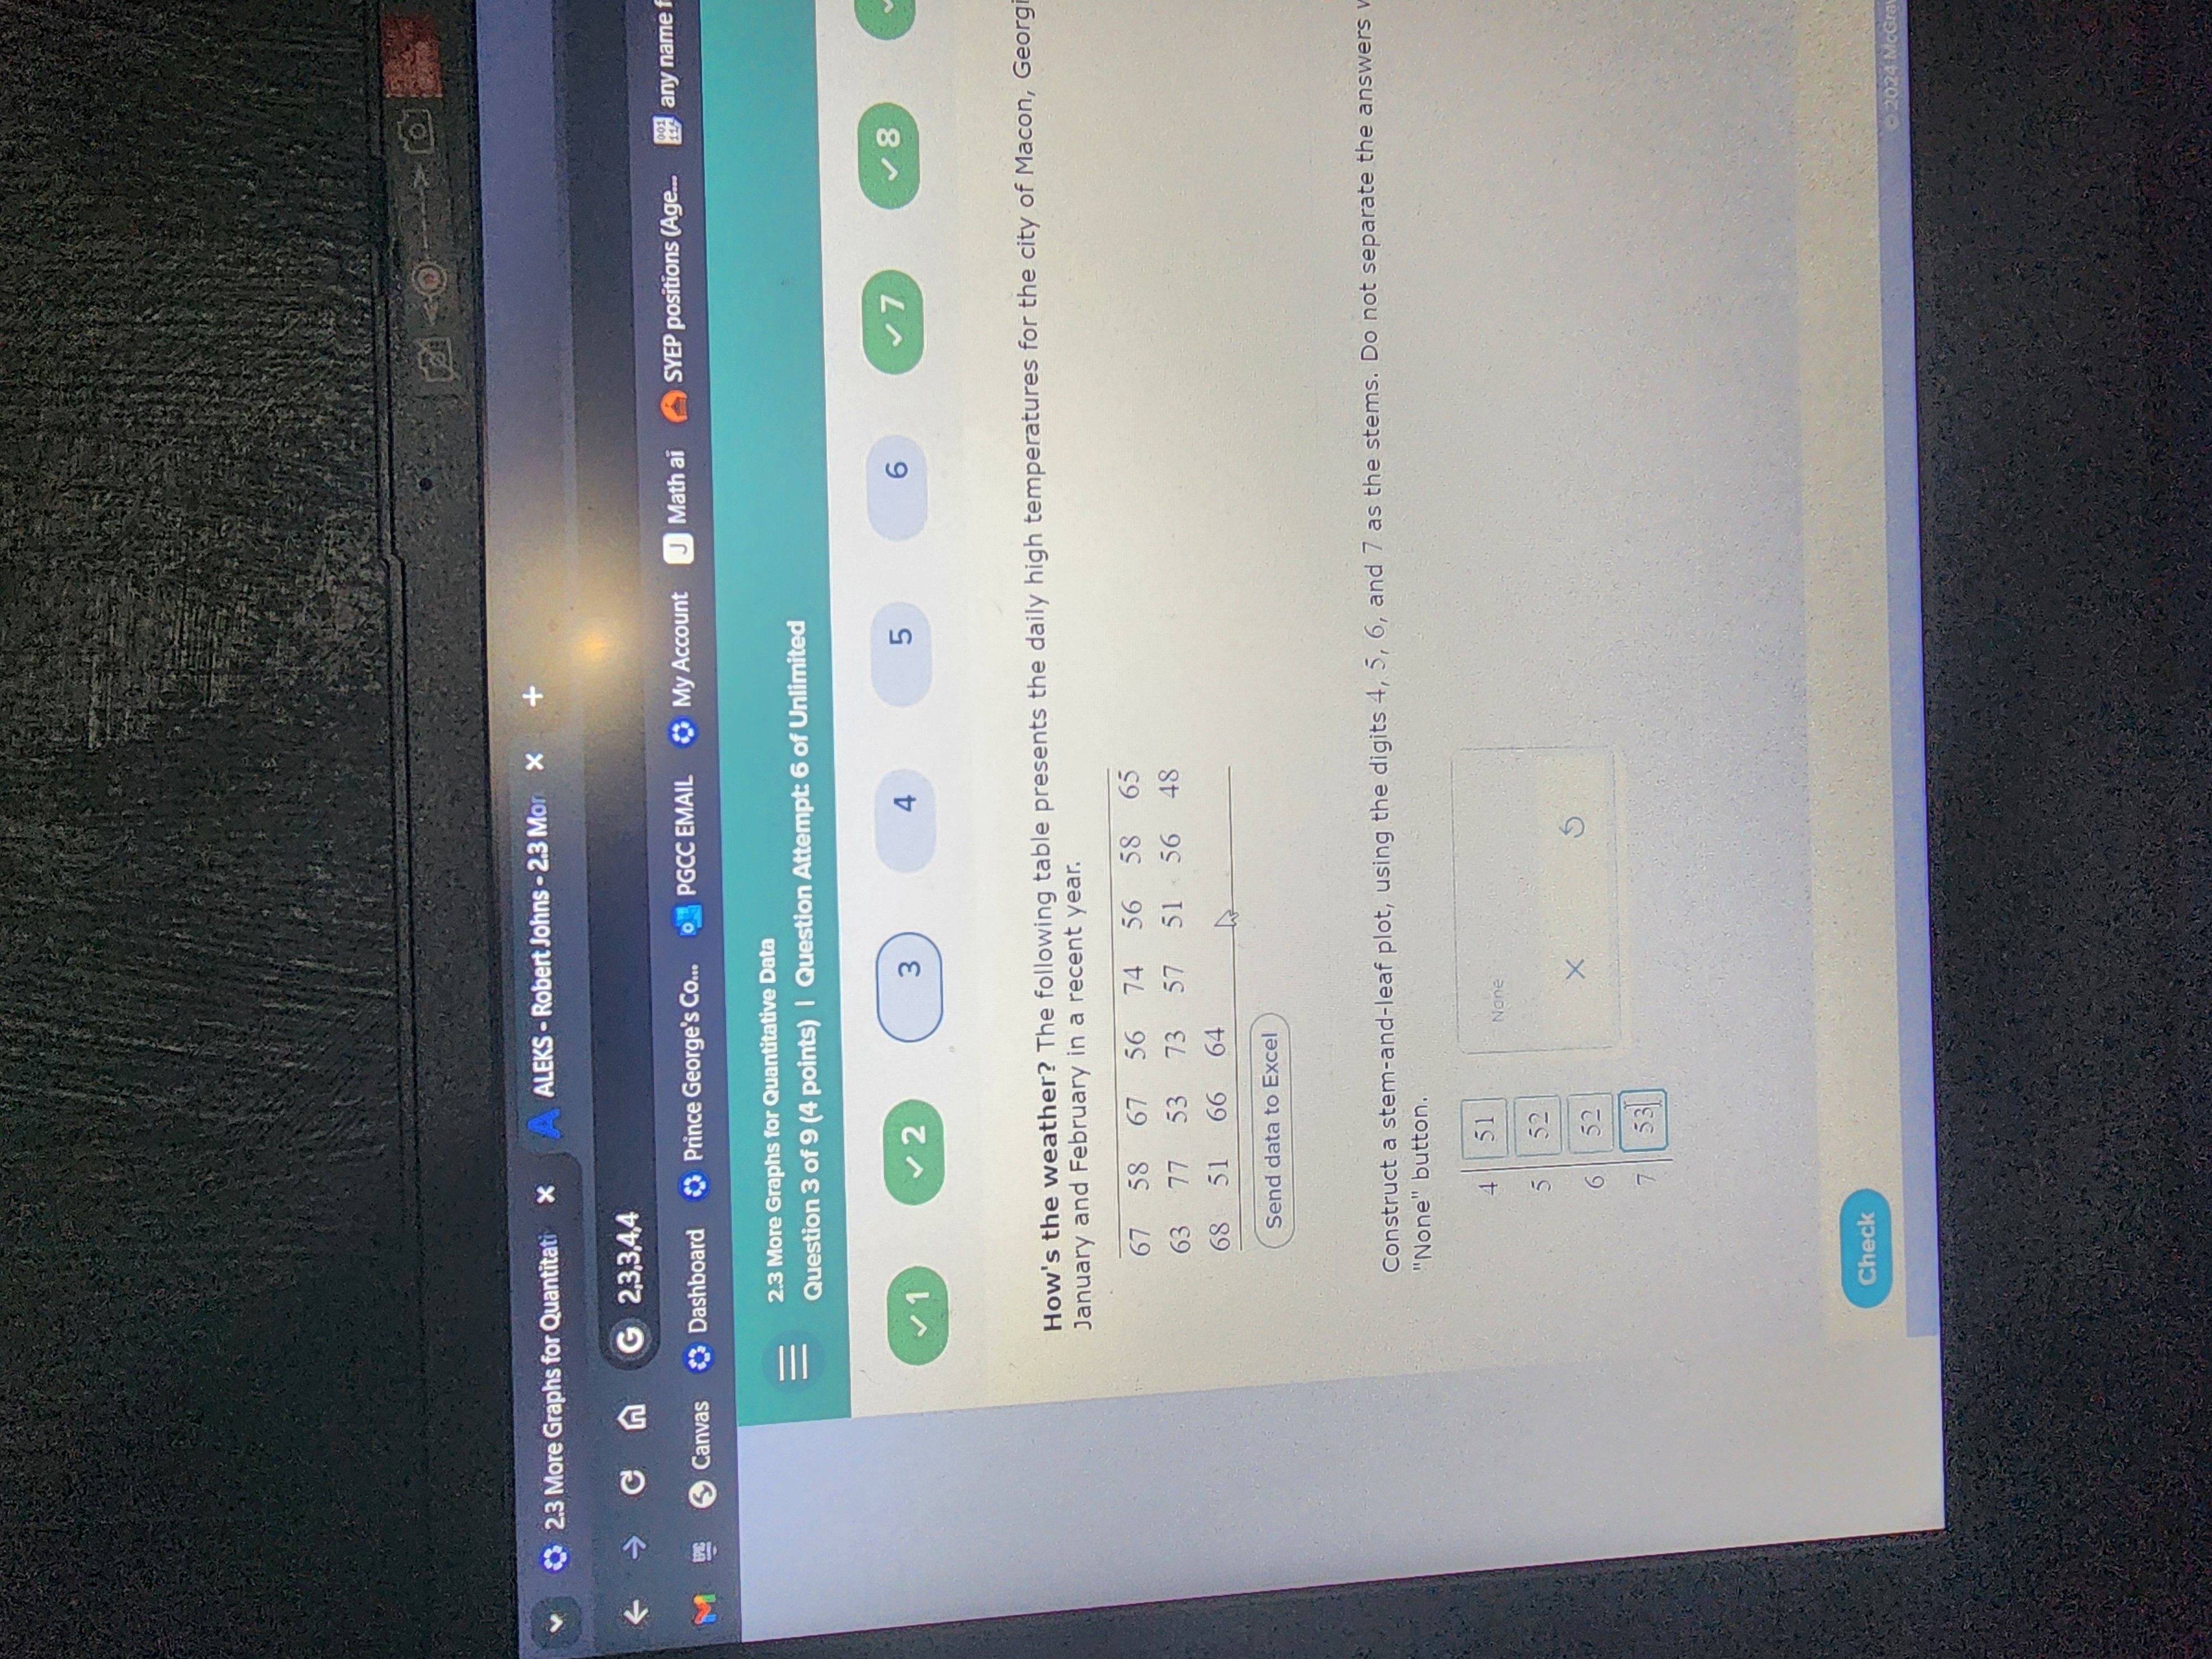
2.3 More Graphs for Quantitati A ALEKS - Robert Johns - 2.3 Mor x C A G 2,3,3,4,4 Canvas Dashboard Prince George's Co... PGCC EMAIL My Account J Math ai SYEP positions (Age.. Be any name 2.3 More Graphs for Quantitative Data Question 3 of 9 (4 points) | Question Attempt: 6 of Unlimited ~ 1 2 3 5 6 V8 How's the weather? The following table presents the daily high temperatures for the city of Macon, Georgi January and February in a recent year. 67 58 56 74 56 58 65 63 77 53 73 57 51 56 48 68 51 66 64 Send data to Excel Construct a stem-and-leaf plot, using the digits 4, 5, 6, and 7 as the stems. Do not separate the answers 'None" button. 51 None 52 52 X 53 Check
Step by Step Solution
There are 3 Steps involved in it

Get step-by-step solutions from verified subject matter experts