

Question: 23. Predicting Steady States and Growth Rates. Using the data in the table in Tab #23 that you downloaded for these two homework problems,
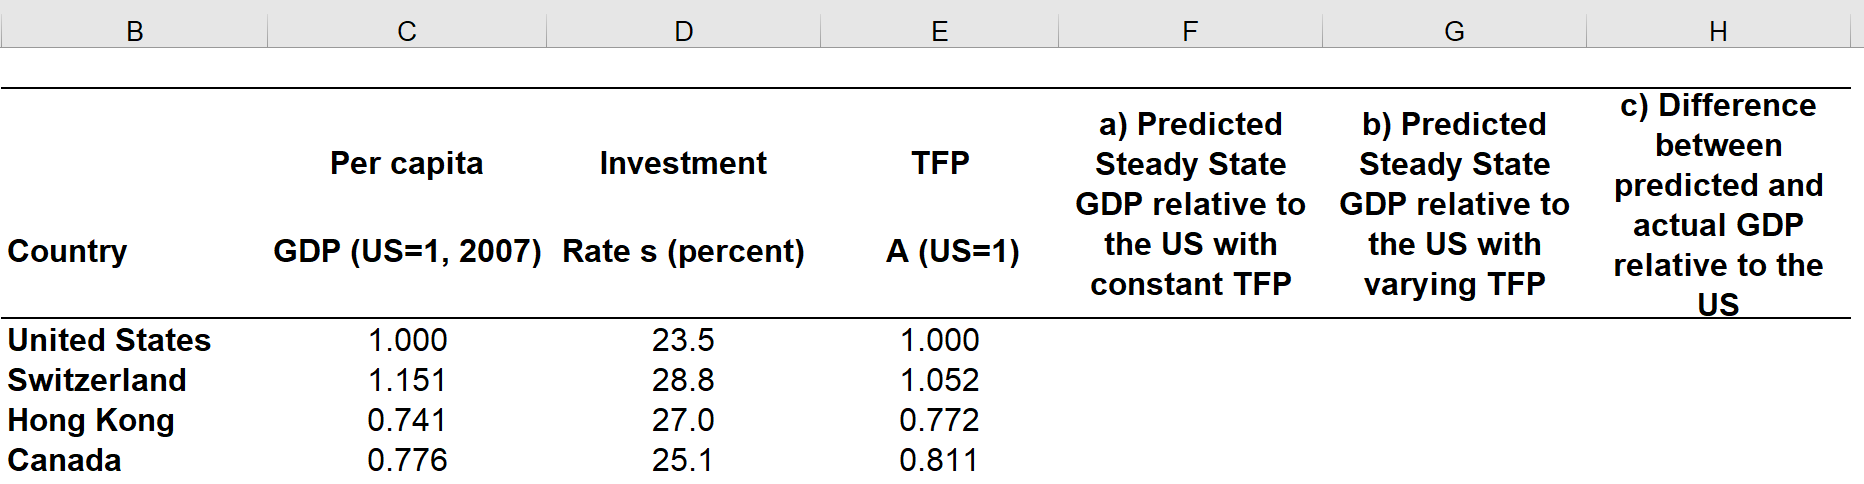
23. Predicting Steady States and Growth Rates. Using the data in the table in Tab #23 that you downloaded for these two homework problems, use that spreadsheet to assist in calculating and reporting the answers to the following questions. a) Assuming no differences in total factor productivity or the rate of depreciation across countries, use the data in the table to predict (in column F) the ratio of per capita GDP in each country relative to that in the United States in their steady states. b) Now do the same exercise assuming TFP is given by the levels in column E of the table. Discuss briefly, i.e., briefly compare and contrast, the differences you find in these two approaches. c) Based on the numbers you find using the TFP differences, compute the difference between the steady-state income ratio you found for part b and the ratio in actual ratio for the year 2017 (as shown in column C of the table).
Step by Step Solution
There are 3 Steps involved in it

Get step-by-step solutions from verified subject matter experts