

Question: (1) The tensile test data given in the table provided in the excel file attached corresponds to a tensile test of a low-carbon steel, with
(1) The tensile test data given in the table provided in the excel file attached corresponds to a tensile test of a low-carbon steel, with a specimen having 12 mm diameter and 50 mm gage length. Breaking load, 27.2 kN; final gage length, 72.8 mm; final diameter, 6.3 mm.
(1.1) Plot the engineering stress-strain curve.
(1.2) Determine the: Modulus of elasticity, upper yield point, 0.2% yield stress, tensile strength, fracture stress, percentage of elongation, percentage of reduction of area.
(1.3) Plot the true stress-strain curve up to maximum load.
(1.4) Determine the value of the plastic modulus (KH) and the strain-hardening exponent (nH) of Hollomon´s work-hardening law.
(1.5) Compare the experimental and predicted true curves.
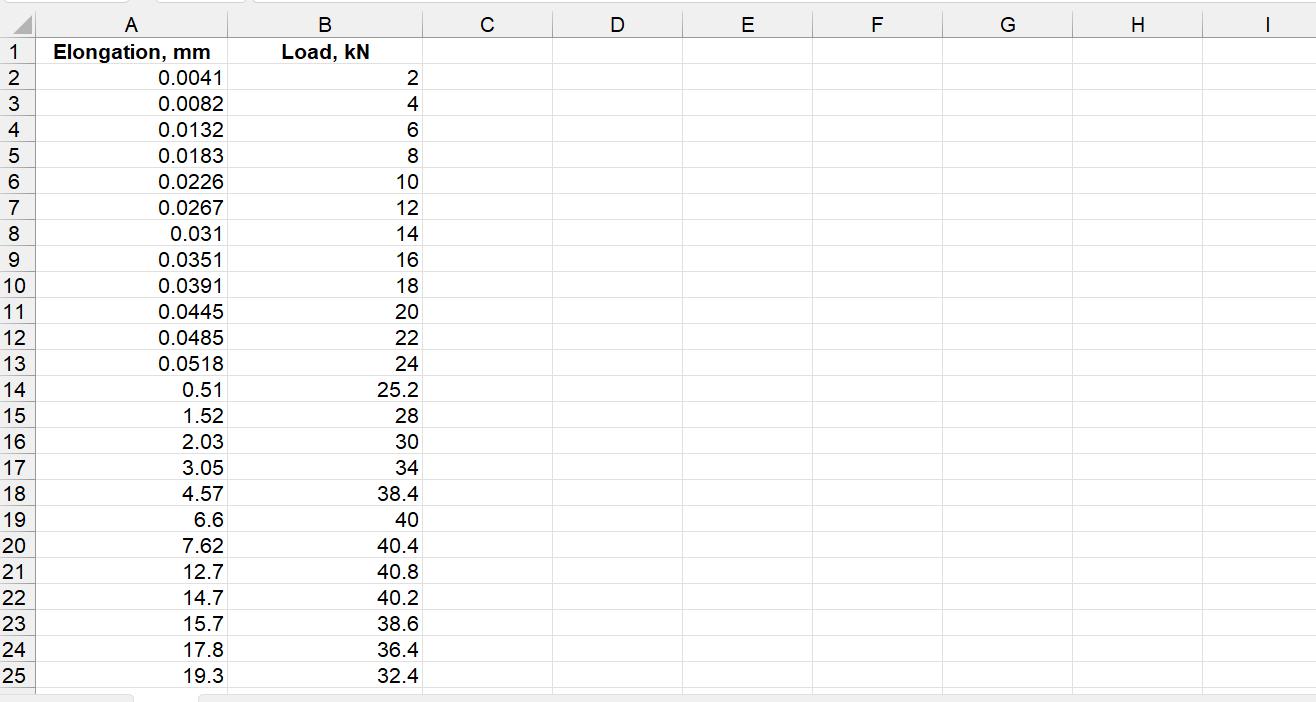
A 1 Elongation, mm 0.0041 0.0082 0.0132 0.0183 0.0226 0.0267 0.031 0.0351 0.0391 0.0445 0.0485 0.0518 2345678 9 10 11 12 13 14 15 16 17 18 19 20 21 22 23 24 25 0.51 1.52 2.03 3.05 4.57 6.6 7.62 12.7 14.7 15.7 17.8 19.3 B Load, KN 246BONNERENNE 8 10 12 14 16 18 20 22 25.2 28 30 34 38.4 40 O4 40.4 40.8 40.2 38.6 36.4 32.4 C D E F H
Step by Step Solution
3.49 Rating (146 Votes )
There are 3 Steps involved in it
11 Plot the engineering stressstrain curve The engineering stressstrain curve is plotted by dividing the load by the original gage area d24 and the el... View full answer

Get step-by-step solutions from verified subject matter experts