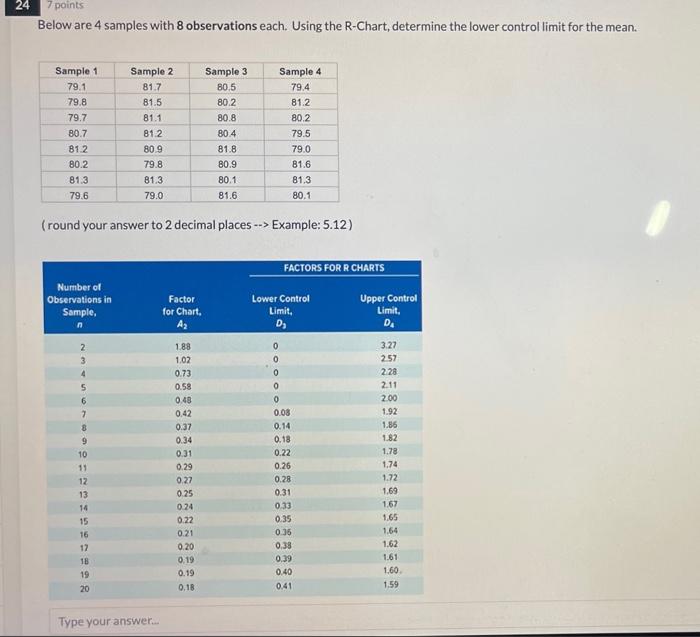
Question: 24 7 points Below are 4 samples with 8 observations each. Using the R-Chart, determine the lower controllimit for the mean. Sample 3 80.5 80.2

24 7 points Below are 4 samples with 8
24 7 points Below are 4 samples with 8 observations each. Using the R-Chart, determine the lower controllimit for the mean. Sample 3 80.5 80.2 80.8 Sample 1 79.1 79.8 79.7 80.7 81.2 80.2 81.3 79.6 Sample 2 81.7 81.5 81.1 81.2 80.9 79.8 81.3 79.0 80.4 81.8 80.9 80.1 81.6 Sample 4 79.4 81.2 80.2 79.5 790 81.6 81,3 80.1 (round your answer to 2 decimal places --> Example: 5.12) FACTORS FOR R CHARTS Number of Observations in Sample, Factor for Chart Az Lower Control Limit, D Upper Control Limit DA 2 3 4 5 6 7 3.27 257 228 2.11 2.00 1.92 1.86 1.82 1.78 1.88 1.02 0.73 0.58 0.48 0.42 0.37 0.34 0.31 0.29 0.27 0.25 0.24 0.22 0.21 0.20 0.19 0.19 0.18 8 9 10 11 12 13 14 15 0 0 0 0 0 0.08 0.14 0.18 0.22 0.26 0.28 0.31 0.33 0.35 0.35 0.38 0.39 0.40 0.41 1.74 1.72 1.69 1.67 16 12 18 19 20 1.65 1.54 1.62 1.61 1,60 1.59 Type your

Step by Step Solution

There are 3 Steps involved in it

1 Expert Approved Answer
Step: 1 Unlock blur-text-image
Question Has Been Solved by an Expert!

Get step-by-step solutions from verified subject matter experts

Step: 2 Unlock
Step: 3 Unlock

Students Have Also Explored These Related General Management Questions!