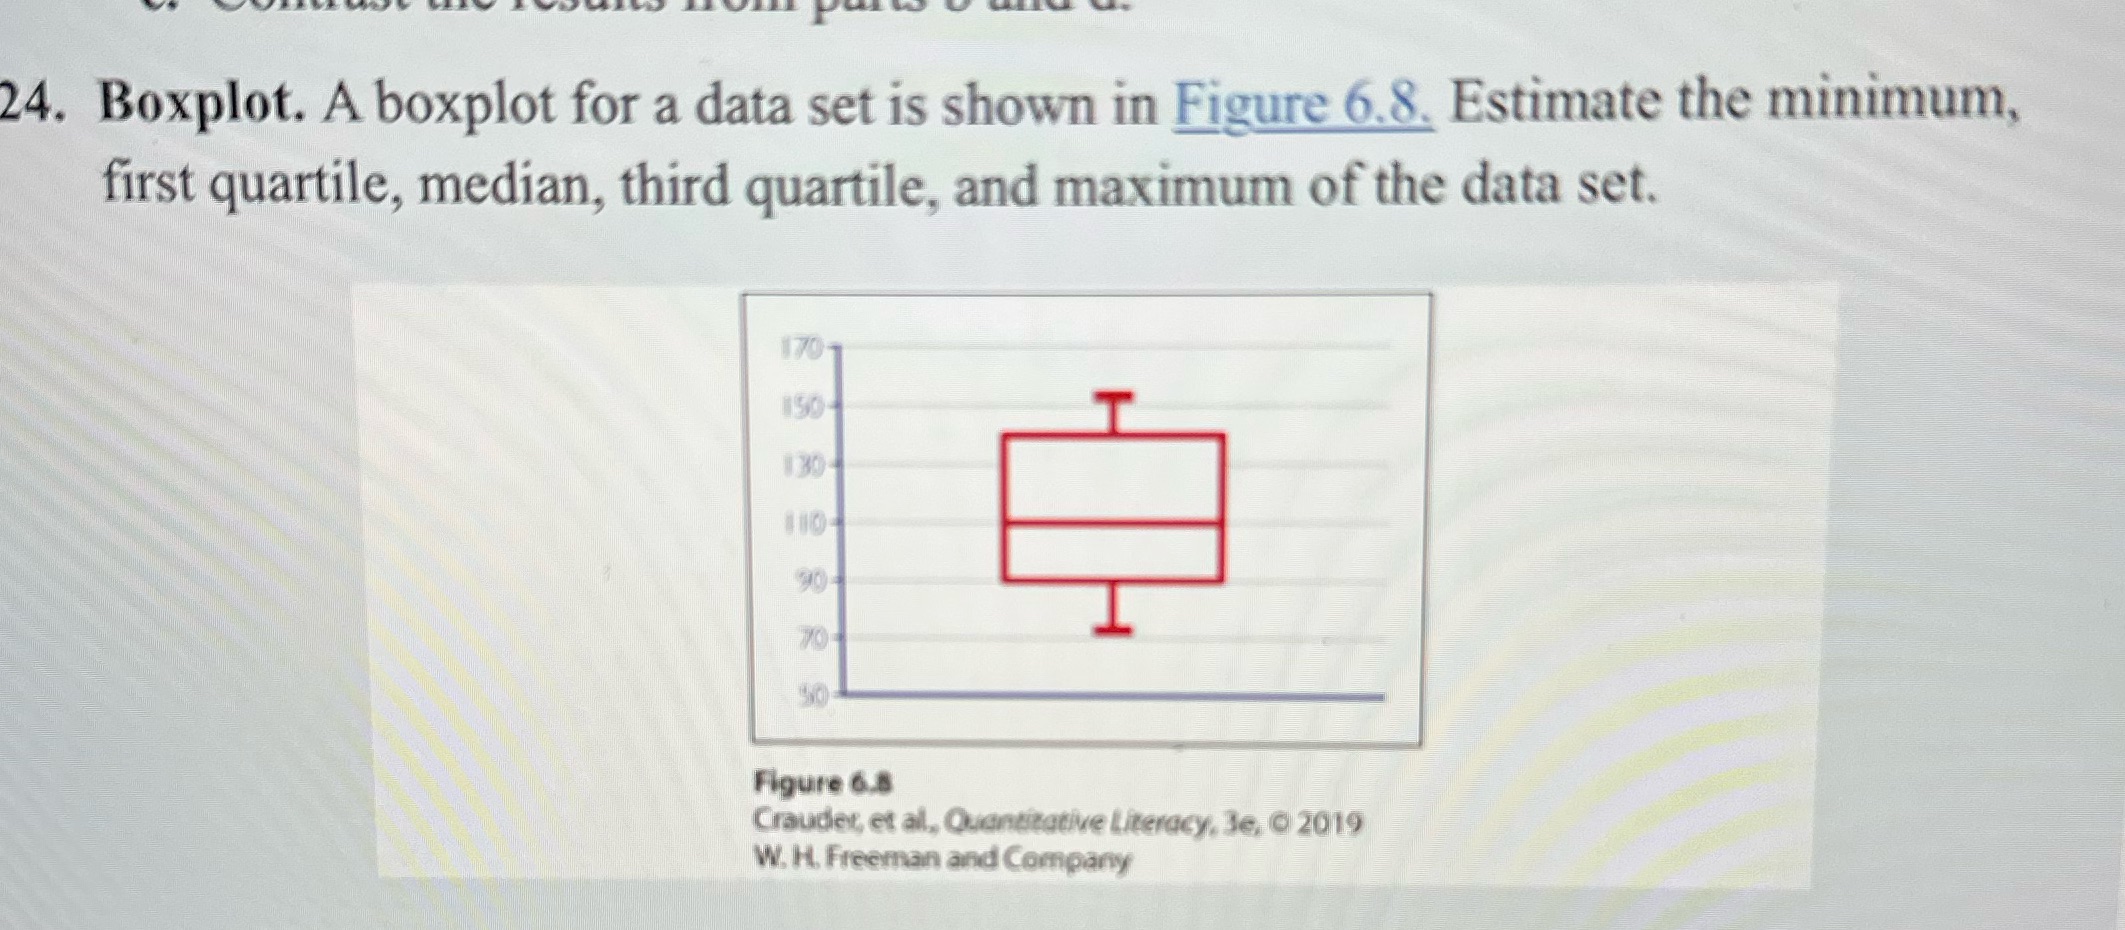
Question: 24. Boxplot. A boxplot for a data set is shown in Figure 6.8. Estimate the minimum, first quartile, median, third quartile, and maximum of the

24. Boxplot. A boxplot for a data set is shown in
24. Boxplot. A boxplot for a data set is shown in Figure 6.8. Estimate the minimum, first quartile, median, third quartile, and maximum of the data set. 170 150- 130 110- 90 70 Figure 6.8 Crauder, et al, Quantitative Literacy, Be, 2019 W. H. Freeman and Company

Step by Step Solution

There are 3 Steps involved in it

1 Expert Approved Answer
Step: 1 Unlock blur-text-image
Question Has Been Solved by an Expert!

Get step-by-step solutions from verified subject matter experts

Step: 2 Unlock
Step: 3 Unlock

Students Have Also Explored These Related Mathematics Questions!