

Question: . 2.4. Data transformation After all necessary time series are provided in order to bring all of the variables into proper proportion, data is normalized.
.
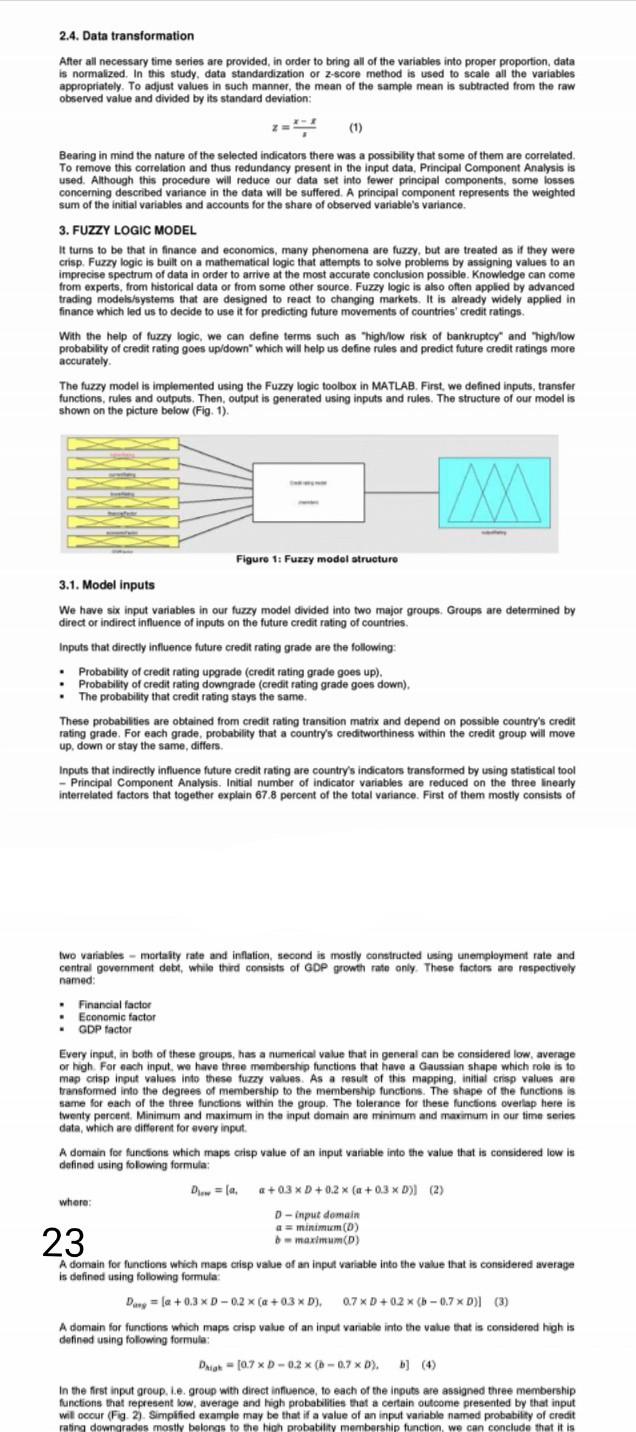
2.4. Data transformation After all necessary time series are provided in order to bring all of the variables into proper proportion, data is normalized. In this study, data standardization or 2-score method is used to scale all the variables appropriately. To adjust values in such manner, the mean of the sample mean is subtracted from the raw observed value and divided by its standard deviation: (1) Bearing in mind the nature of the selected indicators there was a possibility that some of them are correlated. To remove this correlation and thus redundancy present in the input data, Principal Component Analysis is used. Although this procedure will reduce our data set into fewer principal components, some losses concerning described variance in the data will be suffered. A principal component represents the weighted sum of the initial variables and accounts for the share of observed variable's variance. 3. FUZZY LOGIC MODEL It turns to be that in finance and economics, many phenomena are fuzzy, but are treated as if they were crisp Fuzzy logic is built on a mathematical logic that attempts to solve problems by assigning values to an imprecise spectrum of data in order to arrive at the most accurate conclusion possible. Knowledge can come from experts, from historical data or from some other source. Fuzzy logic is also often applied by advanced trading models/systems that are designed to react to changing markets. It is already widely applied in finance which led us to decide to use it for predicting future movements of countries' credit ratings With the help of fuzzy logic, we can define terms such as "high/low risk of bankruptcy" and "highlow probability of credit rating goes up/down which will help us define rules and predict future credit ratings more accurately The fuzzy model is implemented using the Fuzzy logic toolbox in MATLAB. First, we defined inputs, transfer functions, rules and outputs. Then, output is generated using inputs and rules. The structure of our model is shown on the picture below (Fig. 1). Figure 1: Fuzzy model structure 3.1. Model inputs We have six input variables in our fuzzy model divided into two major groups Groups are determined by direct or indirect influence of inputs on the future credit rating of countries Inputs that directly influence future credit rating grade are the following Probability of credit rating upgrade (credit rating grade goes up). Probability of credit rating downgrade (credit rating grade goes down). The probability that credit rating stays the same These probabilities are obtained from credit rating transition matrix and depend on possible country's credit rating grade. For each grade, probability that a country's creditworthiness within the credit group will move up, down or stay the same, differs Inputs that indirectly influence future credit rating are country's indicators transformed by using statistical tool - Principal Component Analysis. Initial number of indicator variables are reduced on the three linearly interrelated factors that together explain 67.8 percent of the total variance. First of them mostly consists of two variables - mortaily rate and inflation, second is mostly constructed using unemployment rate and central government debt, while third consists of GDP growth rate only These factors are respectively named Financial factor Economic factor GDP factor Every input, in both of these groups, has a numerical value that in general can be considered low average or high. For each input, we have three membership functions that have a Gaussian shape which role is to map crisp input values into these fuzzy values. As a result of this mapping, initial crisp values are transformed into the degrees of membership to the membership functions. The shape of the functions is same for each of the three functions within the group. The tolerance for these functions overlap here is twenty percent. Minimum and maximum in the input domain are minimum and maximum in our time series data, which are different for every input 23 A domain for functions which maps crisp value of an input variable into the value that is considered low is defined using folowing formula: D = la. +0.3 x D +0.2 x (a +0.3 x D) (2) where D-input domain a = minimum(D) - maximum(D) A domain for functions which maps crisp value of an input variable into the value that is considered average is defined using following formula: D = +0.3 x D-0.2 x (@+0.3 x D). 0.7 XD +0.2 x (b-0.7 x D)] (3) A domain for functions which maps crisp value of an input variable into the value that is considered high is defined using following formula: Daigh - (0.7 x D-0.2 x (-0.7 x D). In the first input group. I.e. group with direct influence to each of the inputs are assigned three membership functions that represent low, average and high probabilities that a certain outcome presented by that input wil occur (Fig. 2). Simplified example may be that if a value of an input variable named probability of credit rating downgrades mostly belongs to the high probability membership function, we can conclude that it isStep by Step Solution
There are 3 Steps involved in it
1 Expert Approved Answer
Step: 1 Unlock

Question Has Been Solved by an Expert!
Get step-by-step solutions from verified subject matter experts
Step: 2 Unlock
Step: 3 Unlock