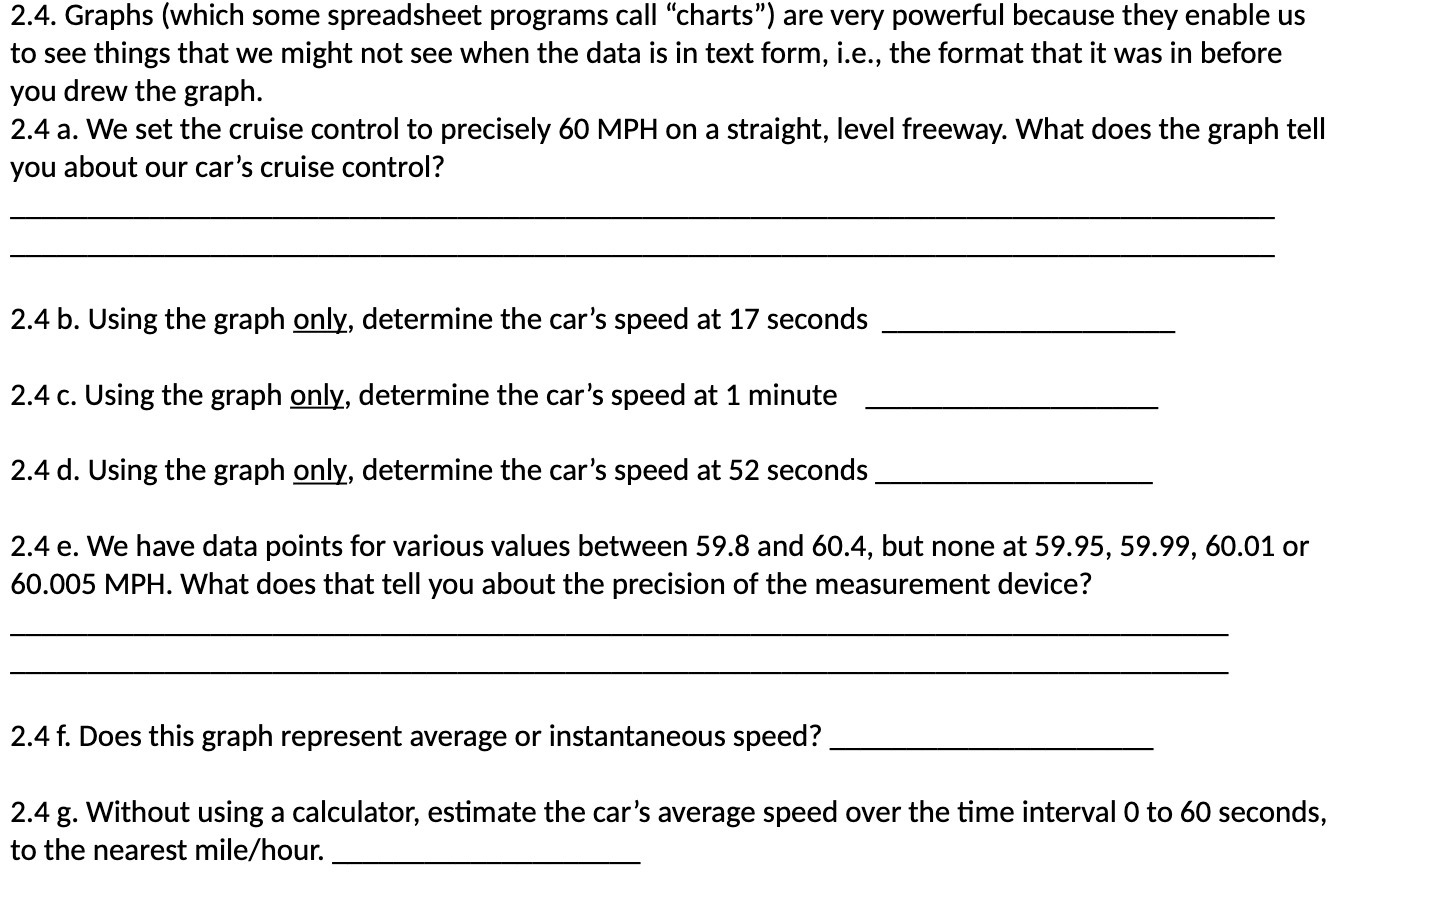
Question: 2.4. Graphs (which some spreadsheet programs call charts) are very powerful because they enable us to see things that we might not see when the

2.4. Graphs (which some spreadsheet programs call
2.4. Graphs (which some spreadsheet programs call "charts") are very powerful because they enable us to see things that we might not see when the data is in text form, i.e., the format that it was in before you drew the graph. 2.4 a. We set the cruise control to precisely 60 MPH on a straight, level freeway. What does the graph tell you about our ca r's cruise control? 2.4 b. Using the graph only, determine the car's speed at 17 seconds 2.4 c. Using the graph only, determine the car's speed at 1 minute 2.4 d. Using the graph only, determine the car's speed at 52 seconds 2.4 e. We have data points for various values between 59.8 and 60.4, but none at 59.95, 59.99, 60.01 or 60.005 MPH. What does that tell you about the precision of the measurement device? 2.4 f. Does this graph represent average or instantaneous speed? 2.4 3. Without using a calculator, estimate the car's average speed over the time interval 0 to 60 seconds, to the nearest mile/ hour

Step by Step Solution

There are 3 Steps involved in it

1 Expert Approved Answer
Step: 1 Unlock blur-text-image
Question Has Been Solved by an Expert!

Get step-by-step solutions from verified subject matter experts

Step: 2 Unlock
Step: 3 Unlock

Students Have Also Explored These Related Mathematics Questions!