

Question: 24. The table below shows the return data for samples which have been pooled from two normally distributed populations with equal variance. Sample # 1
24. The table below shows the return data for samples which have been pooled from two normally distributed populations with equal variance. Sample # 1 2 Sample size 60 112 A. 0.0006. B. 0.0008. C. 0.0011. Annual returns 15.8% 12.5% The standard deviation of the pooled sample, s, is 256.68. Which of the following is the correct test statistic to test for the differences between means?
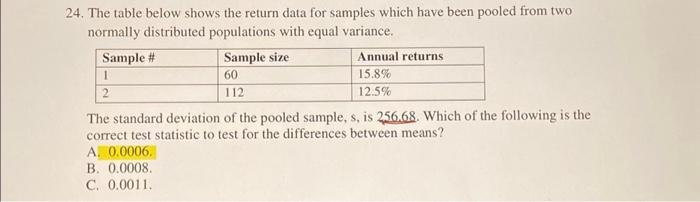
4. The table below shows the return data for samples which have been pooled from two normally distributed populations with equal variance. The standard deviation of the pooled sample, s, is 256.68. Which of the following is the correct test statistic to test for the differences between means? A. 0.0006 . B. 0.0008 . C. 0.0011
Step by Step Solution
There are 3 Steps involved in it
1 Expert Approved Answer
Step: 1 Unlock

Question Has Been Solved by an Expert!
Get step-by-step solutions from verified subject matter experts
Step: 2 Unlock
Step: 3 Unlock