

Question: .246 .393 262 PROBABILITY Binomial Distribution 135 .285 .038 se 20% of the people in a city prefer Pepsi-Cola as their 461 PROBABILITY sample of
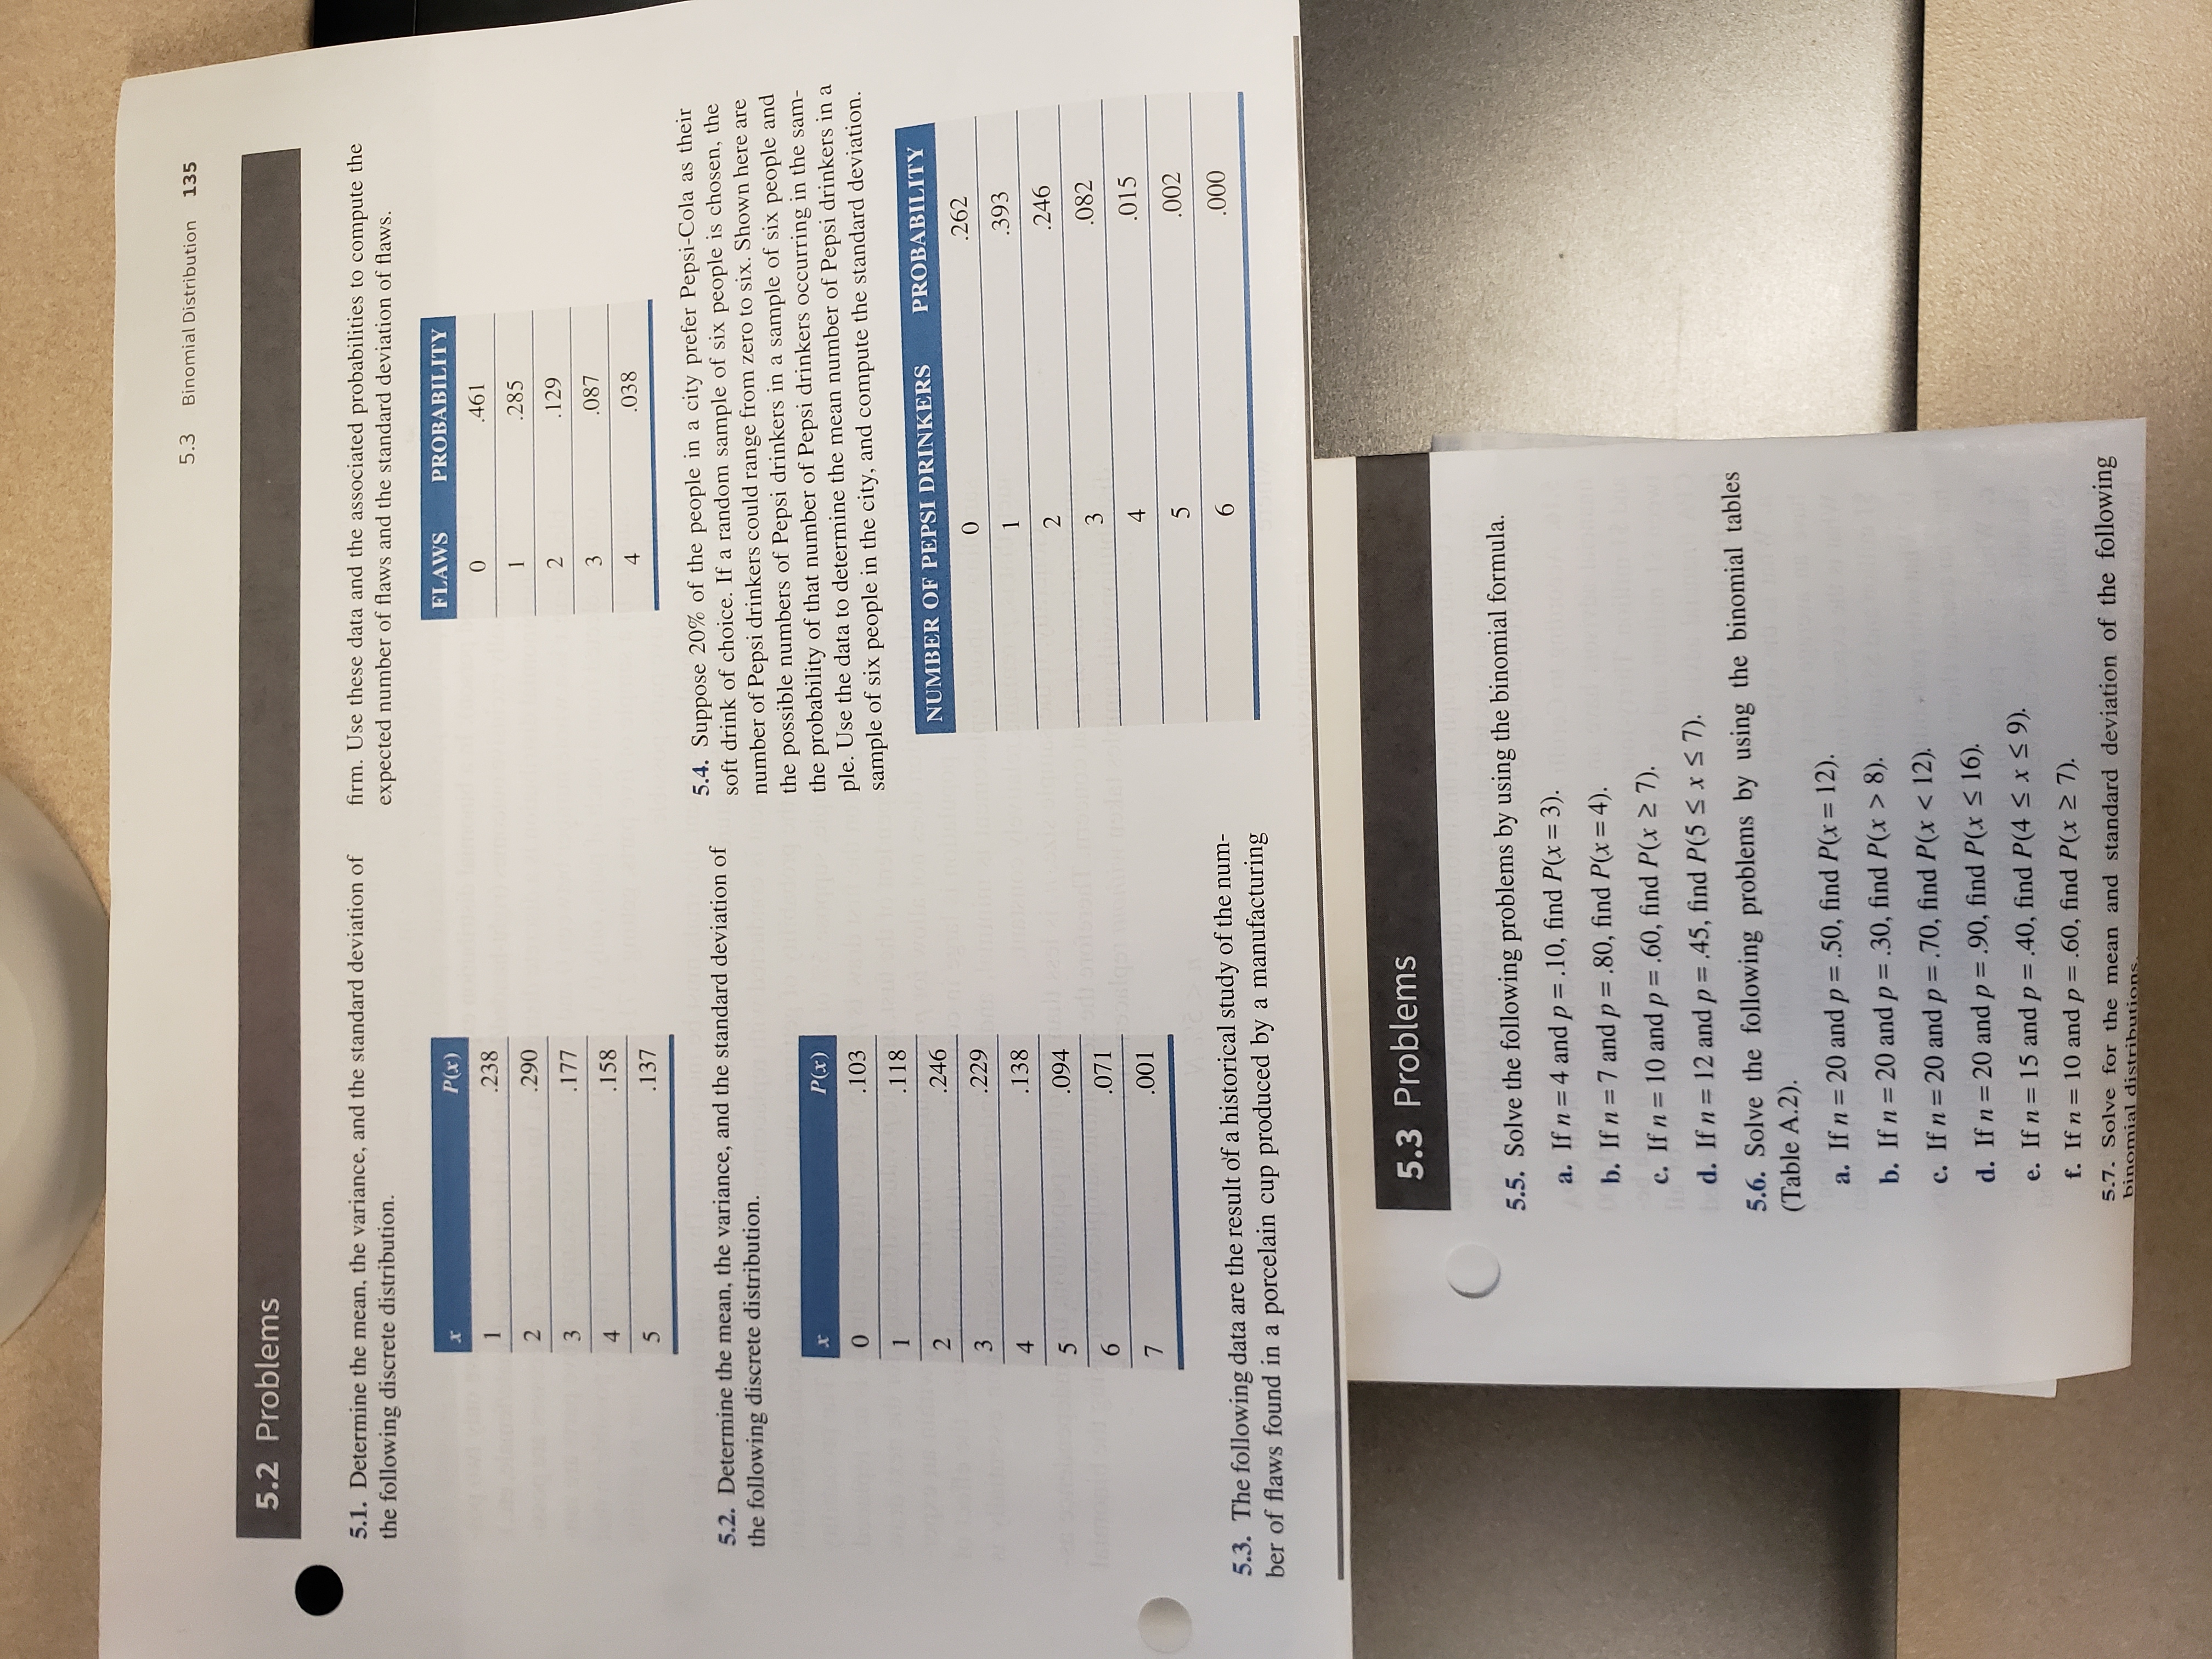
.246 .393 262 PROBABILITY Binomial Distribution 135 .285 .038 se 20% of the people in a city prefer Pepsi-Cola as their 461 PROBABILITY sample of six people in the city, and compute the standard deviation. ple. Use the data to determine the mean number of Pepsi drinkers in a the probability of that number of Pepsi drinkers occurring in the sam number of Pepsi drinkers could range from zero to six. Shown here are the possible numbers of Pepsi drinkers in a sample of six people and soft drink of choice. If a random sample of six people is chosen, the firm. Use these data and the associated probabilities to compute the expected number of flaws and the standard deviation of flaws. NUMBER OF PEPSI DRINKERS FLAWS 5.4. Suppose 209 7. Solve for the mean and standard deviation of the following 5.6. Solve the following problems by using the binomial tables 5.5. Solve the following problems by using the binomial formula. e. If n = 15 and p = .40, find P(4 8). b. If n = 7 and p = .80, find P(x = 4). a. If n = 4 and p = . 10, find P(x = 3). istributions , the variance, and the standard deviation of (x) 103 5.3 Problems .118 .177 .158 .094 001 .238 .246 P(x) 138 .137 binomial distri (Table A.2). 5.1. Determine the mean, the variance, and the standard deviation of 5.3. The following data are the result of a historical study of the num- ber of flaws found in a porcelain cup produced by a manufacturing the following discrete distribution. the following discrete distribution. e the n 5.2 Problems
Step by Step Solution
There are 3 Steps involved in it

Get step-by-step solutions from verified subject matter experts