

Question: 25 Create a 2-D Line chart that compares the stagnant profits to the estimated profits for each of 9 the seven years. Include the year
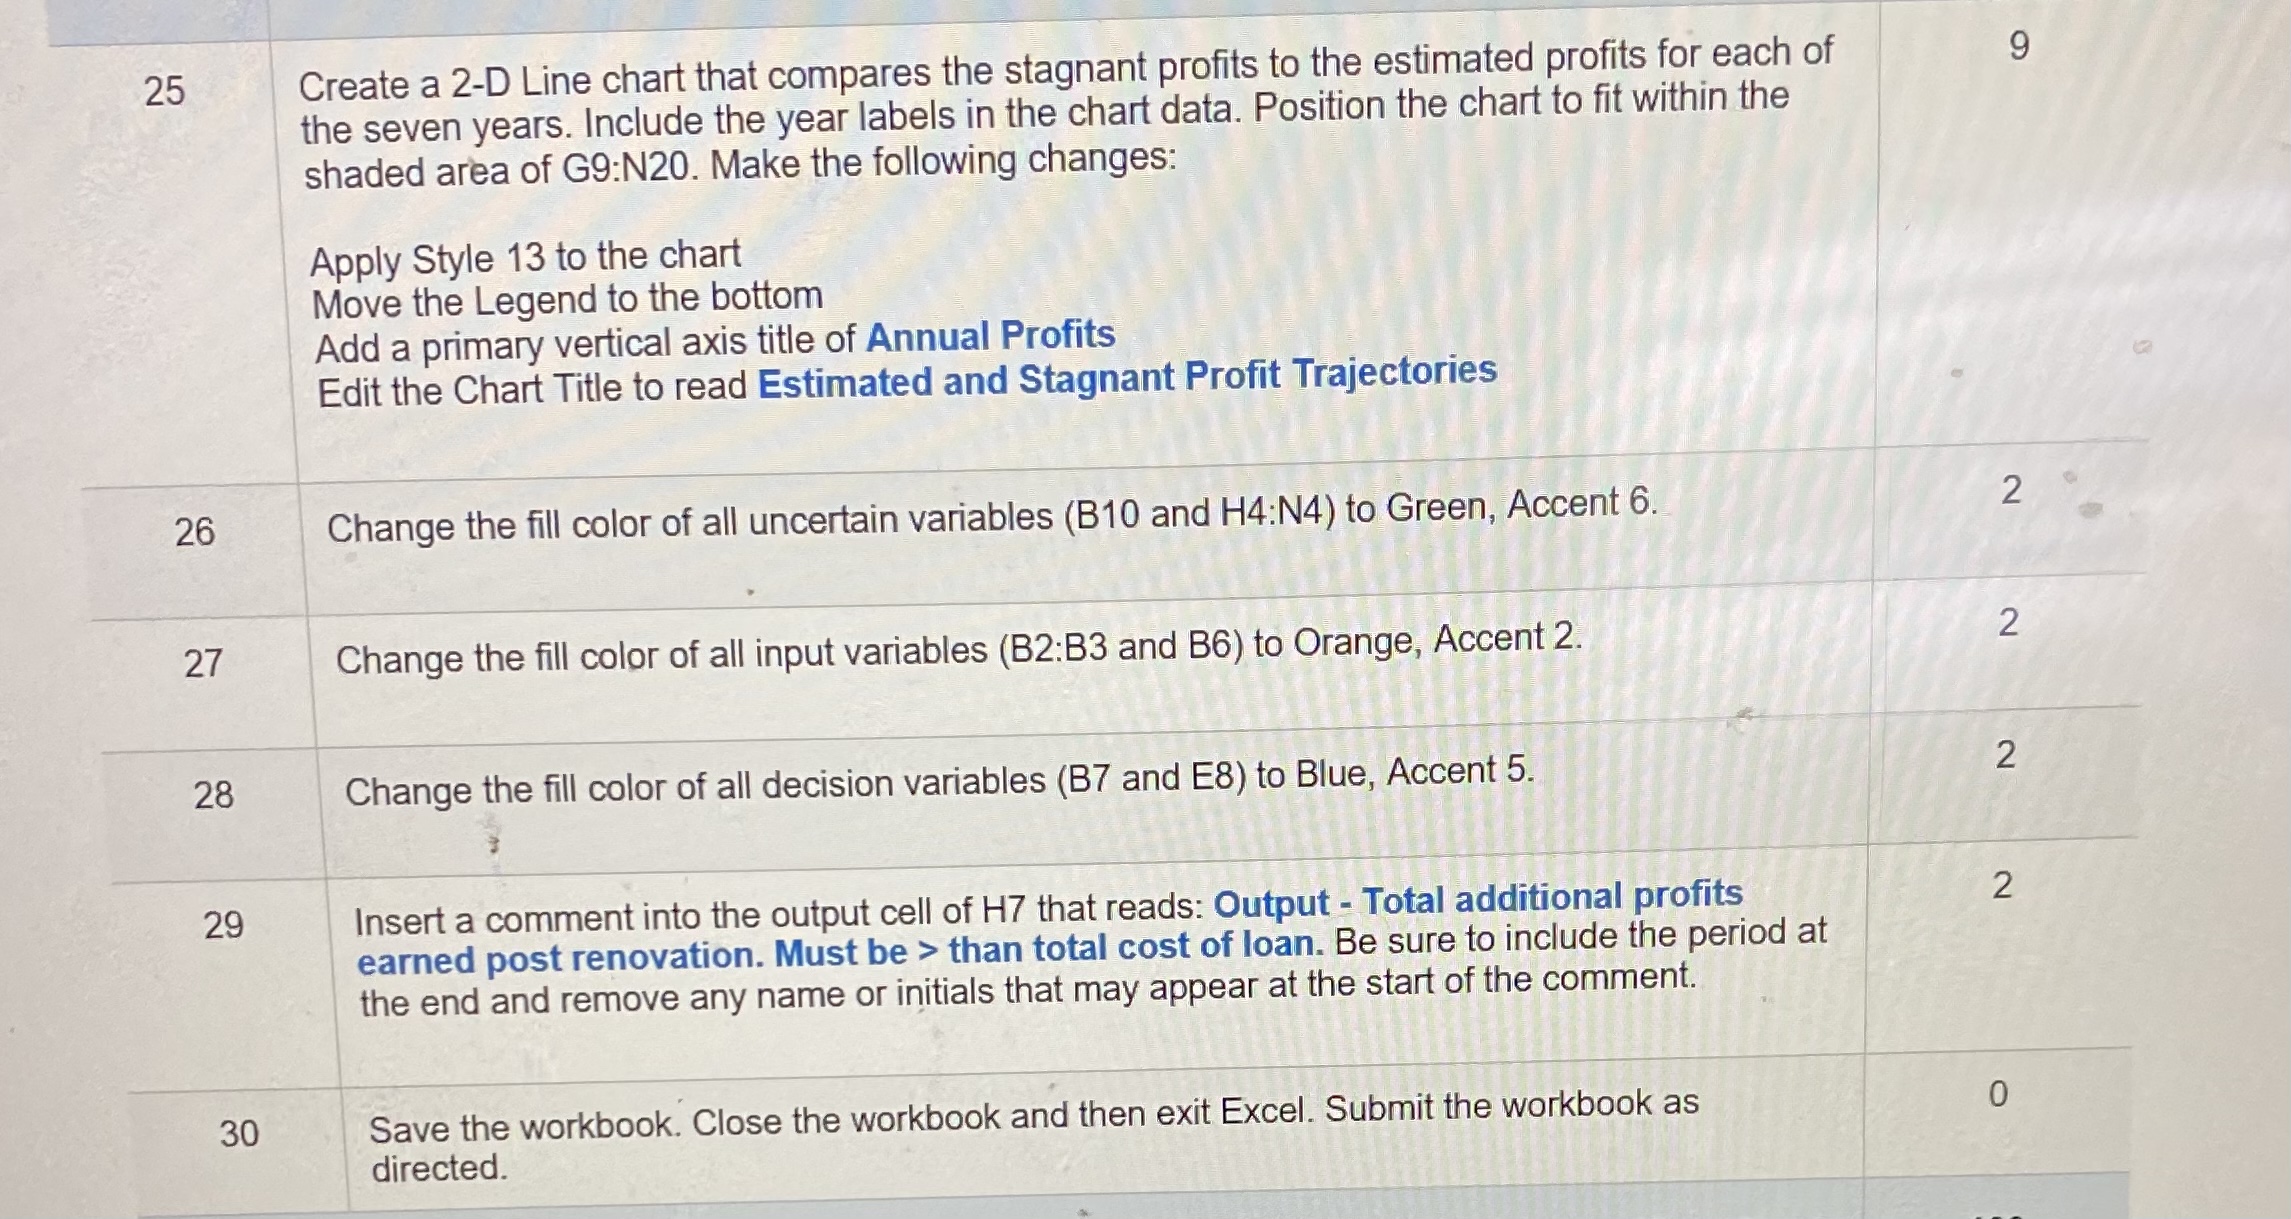
25 Create a 2-D Line chart that compares the stagnant profits to the estimated profits for each of 9 the seven years. Include the year labels in the chart data. Position the chart to fit within the shaded area of G9:N20. Make the following changes: Apply Style 13 to the chart Move the Legend to the bottom Add a primary vertical axis title of Annual Profits Edit the Chart Title to read Estimated and Stagnant Profit Trajectories 26 Change the fill color of all uncertain variables (B10 and H4:N4) to Green, Accent 6. 2 27 Change the fill color of all input variables (B2:B3 and B6) to Orange, Accent 2. 2 28 Change the fill color of all decision variables (B7 and E8) to Blue, Accent 5. 2 29 Insert a comment into the output cell of H7 that reads: Output - Total additional profits 2 earned post renovation. Must be > than total cost of loan. Be sure to include the period at the end and remove any name or initials that may appear at the start of the comment. 30 Save the workbook. Close the workbook and then exit Excel. Submit the workbook as 0 directed
Step by Step Solution
There are 3 Steps involved in it

Get step-by-step solutions from verified subject matter experts