

Question: [25 points) 3) Use the attached Matlab code, and set ka=0.25, 1.00 and 1.25. Plot the modulated and demodulated signals. When does the phase reversal

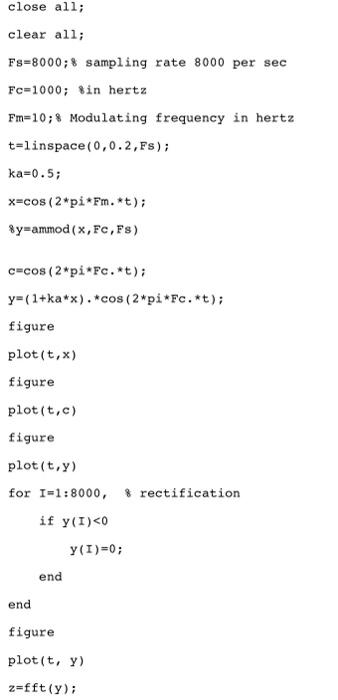
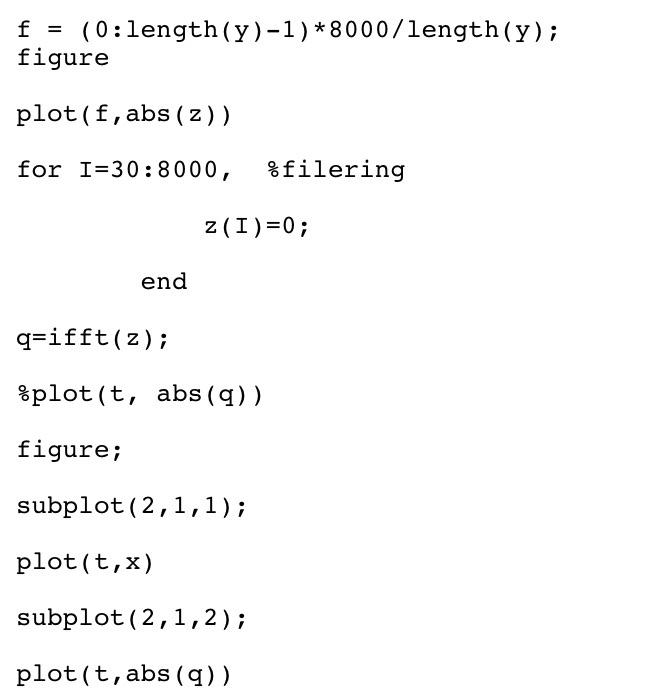
[25 points) 3) Use the attached Matlab code, and set ka=0.25, 1.00 and 1.25. Plot the modulated and demodulated signals. When does the phase reversal occur? What is the drawback of that? close all; clear all; Fs=8000;sampling rate 8000 per sec Fc=1000; Sin hertz Fm=10;$ Modulating frequency in hertz t=linspace(0,0.2,Fs); ka=0.5; x=cos (2*pi*Fm.*t); 8y=ammod (X, FC,Fs) cacos (2*pi*Fc.t); y=(1+ka**). *cos(2pi*Fc.t); figure plot(t, x) figure plot(t,c) figure plot(t,y) for I=1:8000, 8 rectification if y(I)
Step by Step Solution
There are 3 Steps involved in it
1 Expert Approved Answer
Step: 1 Unlock

Question Has Been Solved by an Expert!
Get step-by-step solutions from verified subject matter experts
Step: 2 Unlock
Step: 3 Unlock