

Question: (25 pts) Maximum Likelihood Estimation. Consider the data sequence {I1, 12, - .-, In) of length n = 100000 provided in the file 'data. txt'.

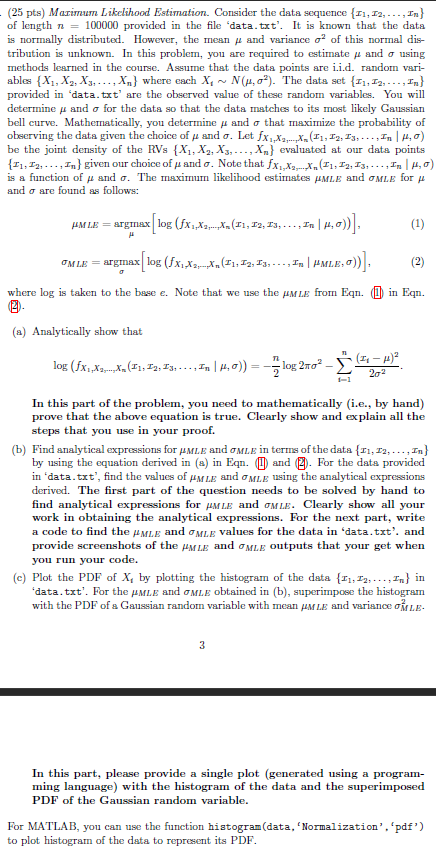
(25 pts) Maximum Likelihood Estimation. Consider the data sequence {I1, 12, - .-, In) of length n = 100000 provided in the file 'data. txt'. It is known that the data is normally distributed. However, the mean a and variance o' of this normal dis- tribution is unknown. In this problem, you are required to estimate a and o using methods learned in the course. Assume that the data points are i.i.d. random vari- ables (X1, X2, Xy, ..., Xn] where each X, ~ N(p, o'). The data set (1, 12, -.., In) provided in 'data. txt' are the observed value of these random variables. You will determine a and o for the data so that the data matches to its most likely Gaussian bell curve. Mathematically, you determine a and o that maximize the probability of observing the data given the choice of p and o. Let fx,,X,,..,X. (11, 12, Ty, . ..; In | #, 7) be the joint density of the RVs {X1, X2, Xs, -.., X,) evaluated at our data points (1: 12, ..., In } given our choice of a and 7. Note that fX,,X3,.X, (11: 12, Is, .. ., In | (, () is a function of & and o. The maximum likelihood estimates AMLE and GMLE for A and o are found as follows: AMLE = argmax log (fX1,X2....,X. (11, 12, X3, . . . ; In | ; ))| (1) ONLE = argInax log (fX, X2,Xn (X1, 12, Is, - - - , In | "MLB. )) . (2) where log is taken to the base e. Note that we use the AMLE from Eqn. (1) in Eqn. (a) Analytically show that log (fX1,X3,..,Xn([1, Iz, Is, . . . , In | /, )) = - log 2ng ME 202 In this part of the problem, you need to mathematically (i.e., by hand) prove that the above equation is true. Clearly show and explain all the steps that you use in your proof. (b) Find analytical expressions for AMLE and OMLE in terms of the data { 11, 12, ..., In} by using the equation derived in (a) in Eqn. (T) and (). For the data provided in 'data. txt', find the values of "MLE and GMLE using the analytical expressions derived. The first part of the question needs to be solved by hand to find analytical expressions for AMLE and OMLE. Clearly show all your work in obtaining the analytical expressions. For the next part, write a code to find the "MLE and GMLE values for the data in 'data. txt'. and provide screenshots of the PYLE and aMLE outputs that your get when you run your code. (c) Plot the PDF of X, by plotting the histogram of the data {f1, 12, ...; In} in 'data. txt'. For the AMLE and GMLE obtained in (b), superimpose the histogram with the PDF of a Gaussian random variable with mean Air Le and variance oMLE. 3 In this part, please provide a single plot (generated using a program- ming language) with the histogram of the data and the superimposed PDF of the Gaussian random variable. For MATLAB, you can use the function histogram (data, 'Normalization' , 'pdf') to plot histogram of the data to represent its PDF
Step by Step Solution
There are 3 Steps involved in it

Get step-by-step solutions from verified subject matter experts