

Question: 25 QUESTION 3 MARKS Industry Average For the Year Ended December 31, 2019 74.5% 70.0% Key Financial Data Dreamscape, Inc. Ratio For the Year Ended
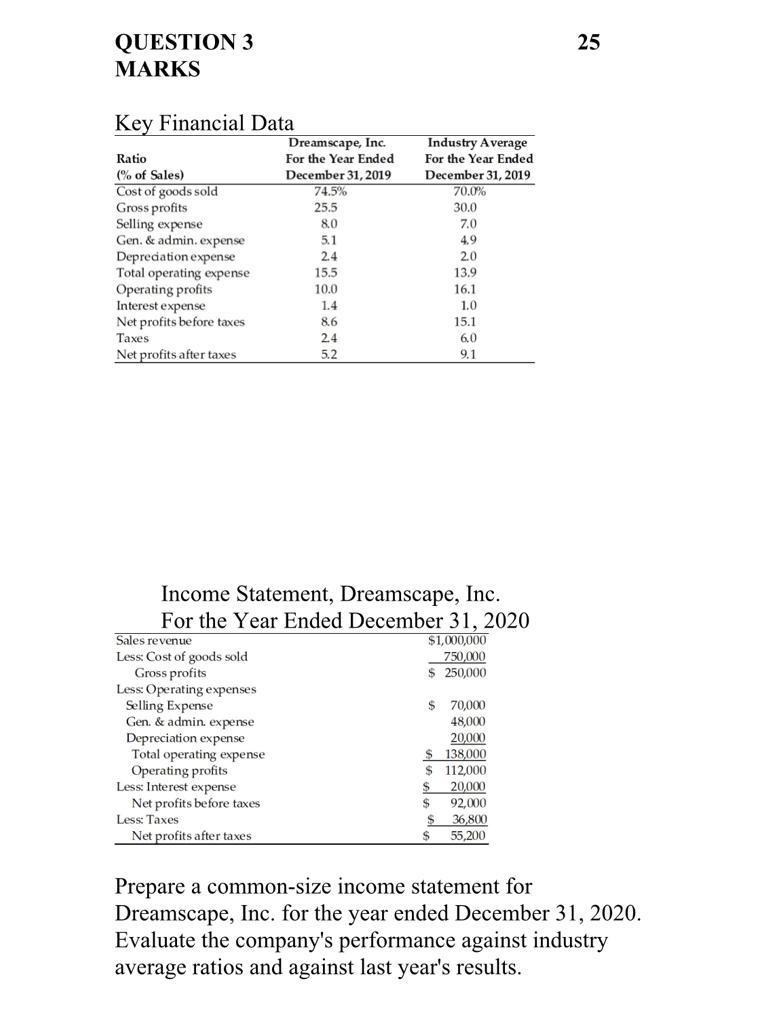
25 QUESTION 3 MARKS Industry Average For the Year Ended December 31, 2019 74.5% 70.0% Key Financial Data Dreamscape, Inc. Ratio For the Year Ended (% of Sales) December 31, 2019 Cost of goods sold Gross profits 25,5 Selling expense so Gen. & admin. expense 51 21 Depreciation expense 2.4 Total operating expense 15.5 Operating profits 100 10.0 Interest expense 1.4 Net profits before taxes 8.6 Taxes 24 Net profits after taxes 5.2 30,0 30.0 70 49 4.9 20 20 139 13.9 161 16.1 1.0 15.1 6.0 9. Income Statement, Dreamscape, Inc. For the Year Ended December 31, 2020 Sales revenue $1,000,000 Less: Cost of goods sold 750,000 Gross profits $ 250,000 Less Operating expenses Selling Expense $ 70,000 Gen. & admin. expense 48,000 Depreciation expense 20,000 Total operating expense $ 138,000 Operating profits $ 112,000 Less Interest expense $ 20,000 Net profits before taxes $ 92,000 Less: Taxes $ 36,800 Net profits after taxes S 55,200 Prepare a common-size income statement for Dreamscape, Inc. for the year ended December 31, 2020. Evaluate the company's performance against industry average ratios and against last year's results
Step by Step Solution
There are 3 Steps involved in it

Get step-by-step solutions from verified subject matter experts