

Question: 25. See Table 2.5 showing financial statement data and stock price data for Mydeco Corp. a. Compare accounts payable days in 2015 and 2019. b.
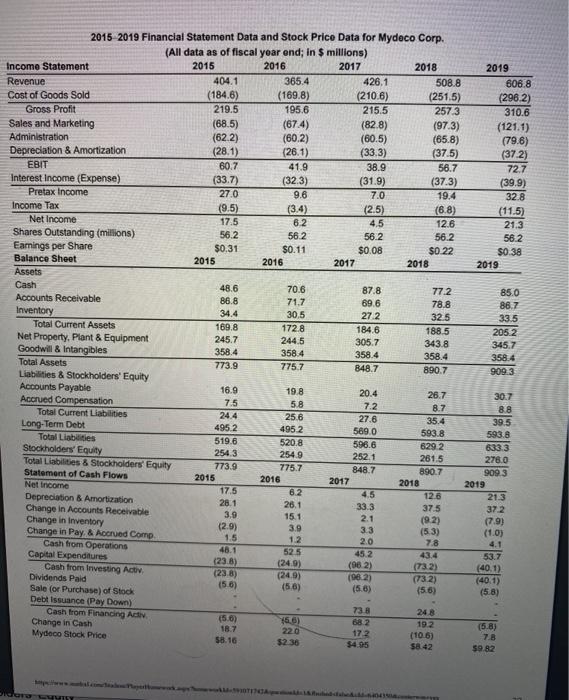
See Table 2.5 showing financial statement data and stock price data for Mydeco Corp. a. Compare accounts payable days in 2015 and 2019. b. Did this change in accounts payable days improve or worsen Mydeco's cash position in 2019? (Note: Use a 365-day year.) a. Compare accounts payable days in 2015 and 2019. The accounts payable days for 2015 is days. (Round to one decimal place.) 2019 328 184.6 2015 2019 Financial Statement Data and Stock Price Data for Mydoco Corp. (All data as of fiscal year end; in $ millions) Income Statement 2015 2016 2017 2018 Revenue 404.1 365.4 426.1 508,8 606.8 Cost of Goods Sold (184.6) (169.8) (210.6) (251.5) (296.2) Gross Profit 219.5 195.6 215.5 2573 310.6 Sales and Marketing (68.5) (674) (82.8) (97.3) (121.1) Administration (62.2) (60.2) (60.5) (65.8) (79.6) Depreciation & Amortization (28.1) (26.1) (33.3) (37.5) (372) EBIT 60.7 41.9 38.9 56.7 72.7 Interest Income (Expense) (33.7) (32.3) (31.9) (37.3) (39.9) Pretax income 27.0 9.6 7.0 19.4 Income Tax (9.5) (3.4) (2.5) (6.8) (11.5) Net Income 17.5 6.2 4.5 12.6 21.3 Shares Outstanding (millions) 56.2 56.2 56.2 56.2 562 Earings per Share $0.31 $0.11 $0.08 $0 22 50.38 Balance Sheet 2015 2016 2017 2018 2019 Assets Cash 48.6 70.6 87.8 77.2 85.0 Accounts Receivable 86.8 71.7 69.6 78.8 86.7 Inventory 34.4 30,5 27 2 32.5 33.5 Total Current Assets 169.8 172.8 188.5 2052 Net Property, Plant & Equipment 245.7 244,5 305.7 343.8 345.7 Goodwill 8 Intangibles 358.4 358.4 358.4 358.4 358.4 Total Assets 773.9 775.7 848.7 890.7 909.3 Liabilities & Stockholders' Equity Accounts Payable 16.9 19.8 20.4 26.7 30.7 Accrued Compensation 7.5 5.8 7.2 8.7 8.8 Total Current Liabilities 24.4 25.6 27.6 35.4 39.5 Long-Term Debt 495 2 495 2 569.0 593.8 593.8 Total Liabilities 519.6 520.8 596.6 629.2 6333 Stockholders' Equity 254 3 254.9 252.1 261.5 278.0 Total Liabilities & Stockholders' Equity 773.9 775.7 848.7 Statement of Cash Flows 890.7 909.3 2015 2016 2017 Net Income 2018 2019 17.5 62 4.5 Depreciation & Amortization 126 21.3 28.1 33.3 Change in Accounts Receivable 37.5 372 3,0 15.1 2.1 Change in Inventory (9.2) (7.9) (2.9) 3.9 Change in Pay & Accrued Comp 3.3 (53) (1.0) 1.5 1.2 2.0 7.8 Cash from Operations 46.1 Capital Expenditures 525 45.2 53.7 (23.8) (962) Cash from Investing Activ (732) (401) (238) Dividends Paid (249) (982) (401) (56) Sale (or Purchase) of Stock (5.6) (56) (58) Debt Issuance (Pay Down) 738 Cash from Financing Activ 248 (56) Change in Cash 68 2 192 (5.8) 18.7 220 Mydeco Stock Price 172 (106) 7.8 58.10 $236 58 42 $9.82 26.1 43.4 (249) (732)
Step by Step Solution
There are 3 Steps involved in it

Get step-by-step solutions from verified subject matter experts