

Question: Table summarizes Portfolio performance for 3 securities (JNJ, WFC, CAT). Calculate Portfolio's Total Geometric Return over this time period. # of shares-> Date 8/1/2021
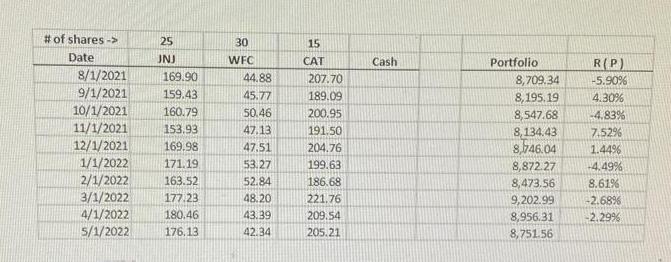
Table summarizes Portfolio performance for 3 securities (JNJ, WFC, CAT). Calculate Portfolio's Total Geometric Return over this time period. # of shares-> Date 8/1/2021 9/1/2021 10/1/2021 11/1/2021 12/1/2021 1/1/2022 2/1/2022 3/1/2022 4/1/2022 5/1/2022 25 JNJ 169.90 159.43 160.79 153.93 169.98 171.19 163.52 177.23 180.46 176.13 30 WFC 44.88 45.77 50.46 47.13 47.51 53.27 52.84 48.20 43.39 42.34 15 CAT 207.70 189.09 200.95 191.50 204.76 199.63 186.68 221.76 209.54 205.21 Cash Portfolio 8,709.34 8,195.19 8,547.68 8,134.43 8,746.04 8,872.27 8,473.56 9,202.99 8,956.31 8,751.56 R(P) -5.90% 4.30% -4.83% 7.52% 1.44% -4.49% 8.61% -2.68% -2.29%
Step by Step Solution
3.41 Rating (151 Votes )
There are 3 Steps involved in it
To calculate the portfolios total geometric return over the given time period we need to use the geo... View full answer

Get step-by-step solutions from verified subject matter experts