

Question: 25 The following data is for a grinding process. The raw (individual) data are shown in the table, and the averages (grouped) data as well
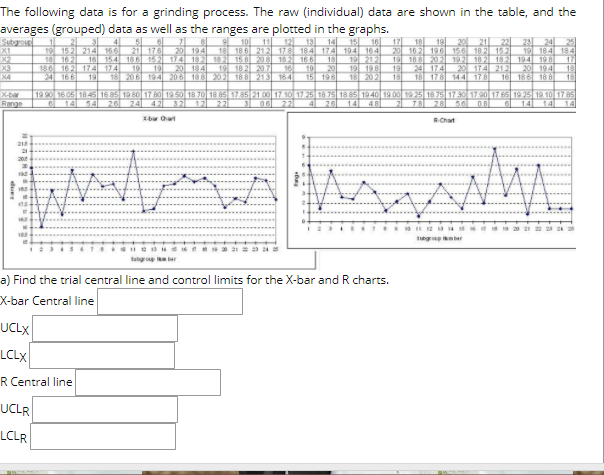
25 The following data is for a grinding process. The raw (individual) data are shown in the table, and the averages (grouped) data as well as the ranges are plotted in the graphs. 51 2 10 10 12181 15 16 18 2021221 X1 19152214166 20194 1818 6212178 184 174 104 164 2016 21976 156182152 19 184 1841 13 154 155 174 1103 110 19 202 19 20 11 X2 174 174 101 19 19 182207 16 19 20 19198 2017422 20194 10 24166 18206119420 8188120218 218164 15195 18202 181781 1441761 16 186100 1 X4 18 1990 1605 1845 185 1950 7 0 1950 180 185 0785 71001770 75 187 1889 1940 1900 1925 1875 18790 07651925 19:07 E Chart nations and a) Find the trial central line and control limits for the X-bar and R charts. X-bar Central line UCLX LCLX R Central line UCLR LCLR 25 The following data is for a grinding process. The raw (individual) data are shown in the table, and the averages (grouped) data as well as the ranges are plotted in the graphs. 51 2 10 10 12181 15 16 18 2021221 X1 19152214166 20194 1818 6212178 184 174 104 164 2016 21976 156182152 19 184 1841 13 154 155 174 1103 110 19 202 19 20 11 X2 174 174 101 19 19 182207 16 19 20 19198 2017422 20194 10 24166 18206119420 8188120218 218164 15195 18202 181781 1441761 16 186100 1 X4 18 1990 1605 1845 185 1950 7 0 1950 180 185 0785 71001770 75 187 1889 1940 1900 1925 1875 18790 07651925 19:07 E Chart nations and a) Find the trial central line and control limits for the X-bar and R charts. X-bar Central line UCLX LCLX R Central line UCLR LCLR
Step by Step Solution
There are 3 Steps involved in it

Get step-by-step solutions from verified subject matter experts