

Question: 253% T Text tv Share View Zoom Insert Table Chart Shape Media Comment Tips Format Document The table below shows the results of your calculations
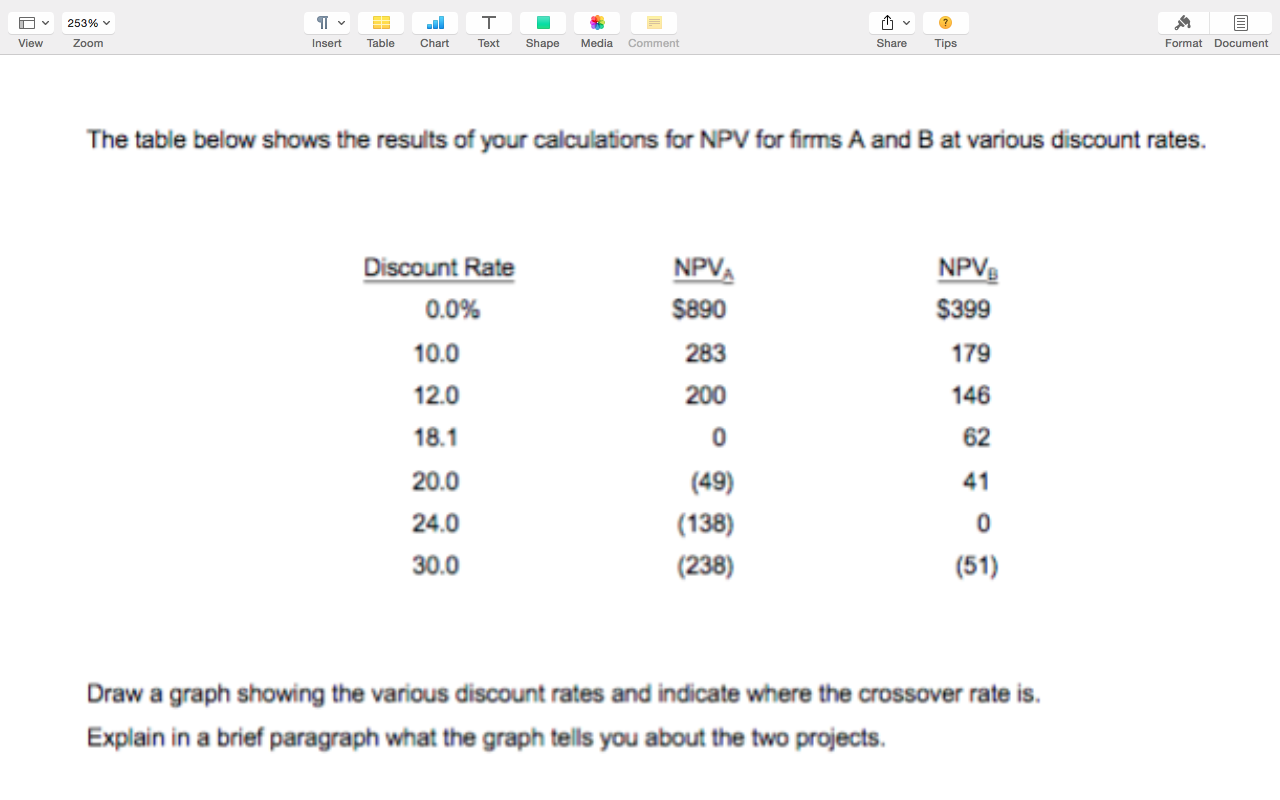
253% T Text tv Share View Zoom Insert Table Chart Shape Media Comment Tips Format Document The table below shows the results of your calculations for NPV for firms A and B at various discount rates. Discount Rate 0.0% 10.0 12.0 18.1 20.0 24.0 30.0 NPVA $890 283 200 0 (49) (138) (238) NPV, $399 179 146 62 41 0 (51) Draw a graph showing the various discount rates and indicate where the crossover rate is. Explain in a brief paragraph what the graph tells you about the two projects
Step by Step Solution
There are 3 Steps involved in it
1 Expert Approved Answer
Step: 1 Unlock

Question Has Been Solved by an Expert!
Get step-by-step solutions from verified subject matter experts
Step: 2 Unlock
Step: 3 Unlock