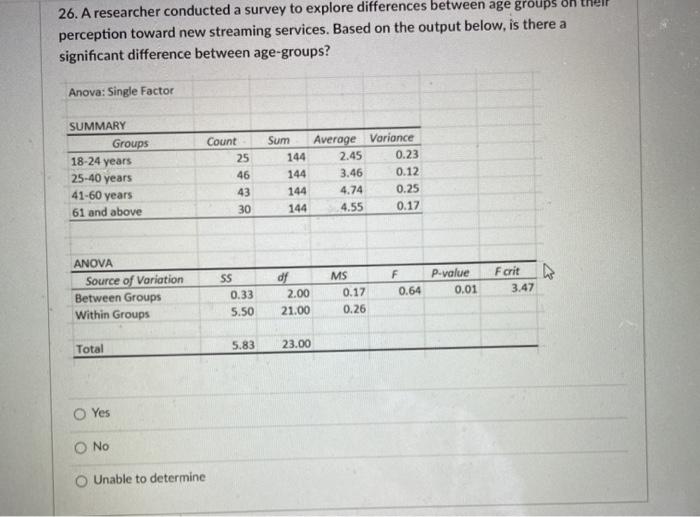
Question: 26. A researcher conducted a survey to explore differences between age groups perception toward new streaming services. Based on the output below, is there a

26. A researcher conducted a survey to explore
26. A researcher conducted a survey to explore differences between age groups perception toward new streaming services. Based on the output below, is there a significant difference between age-groups? Anova: Single Factor SUMMARY Groups 18-24 years 25-40 years 41-60 years 61 and above Count 25 46 43 30 Sum Average Variance 144 2.45 0.23 144 3.46 0.12 144 4.74 0.25 144 4.55 0.17 Fcrit ANOVA Source of Variation Between Groups Within Groups df 2.00 21.00 SS 0.33 5.50 MS 0.17 0.26 P-value 0.01 F 0.64 3.47 Total 5.83 23.00 Yes No Unable to determine The exhibit below shows data from a company's balance sheet. The balance sheet indicates the return on investment (ROI) for the company. Assume now there is a 10% increase in raw material cost. Calculate the change rate of Inventory Turnover. Business Performance before Improvement SALES $5,000 LABOR $700 MINUS Operating Costs MATERIALS $2,300 COGS SUSOO NET INCOME $100 PROFIT MARGIN 8% DIVIDED BY OTHER COSTS OVERHEAD $800 $800 SALES $5,000 MULTIPLY ROI 10.0% INVENTORY $500 SALES 55.000 Assets RECEIVABLE $300 Current Assets $1,100 DIVIDED BY Asset Tumover Ratio 1.25 PLUS Total Assets $4,000 CASH $300 Fixed Assets $2.900 Calculate the change rate of Inventory Turnover. O -0.036 0 0.036 O 10 O 0.422 26. A researcher conducted a survey to explore differences between age groups perception toward new streaming services. Based on the output below, is there a significant difference between age-groups? Anova: Single Factor SUMMARY Groups 18-24 years 25-40 years 41-60 years 61 and above Count 25 46 43 30 Sum Average Variance 144 2.45 0.23 144 3.46 0.12 144 4.74 0.25 144 4.55 0.17 Fcrit ANOVA Source of Variation Between Groups Within Groups df 2.00 21.00 SS 0.33 5.50 MS 0.17 0.26 P-value 0.01 F 0.64 3.47 Total 5.83 23.00 Yes No Unable to determine The exhibit below shows data from a company's balance sheet. The balance sheet indicates the return on investment (ROI) for the company. Assume now there is a 10% increase in raw material cost. Calculate the change rate of Inventory Turnover. Business Performance before Improvement SALES $5,000 LABOR $700 MINUS Operating Costs MATERIALS $2,300 COGS SUSOO NET INCOME $100 PROFIT MARGIN 8% DIVIDED BY OTHER COSTS OVERHEAD $800 $800 SALES $5,000 MULTIPLY ROI 10.0% INVENTORY $500 SALES 55.000 Assets RECEIVABLE $300 Current Assets $1,100 DIVIDED BY Asset Tumover Ratio 1.25 PLUS Total Assets $4,000 CASH $300 Fixed Assets $2.900 Calculate the change rate of Inventory Turnover. O -0.036 0 0.036 O 10 O 0.422

Step by Step Solution

There are 3 Steps involved in it

1 Expert Approved Answer
Step: 1 Unlock blur-text-image
Question Has Been Solved by an Expert!

Get step-by-step solutions from verified subject matter experts

Step: 2 Unlock
Step: 3 Unlock

Students Have Also Explored These Related General Management Questions!