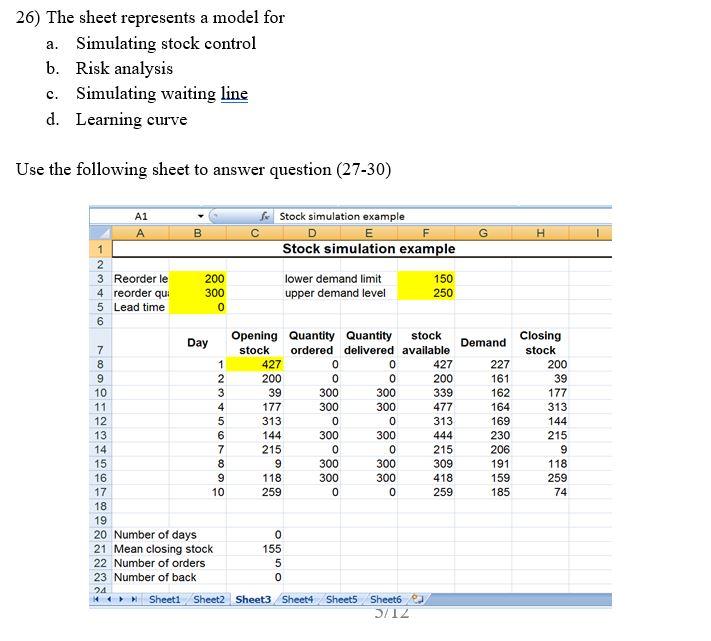
Question: 26) The sheet represents a model for a. Simulating stock control b. Risk analysis c. Simulating waiting line d. Learning curve Use the following sheet

26) The sheet represents a model for a.

26) The sheet represents a model for a. Simulating stock control b. Risk analysis c. Simulating waiting line d. Learning curve Use the following sheet to answer question (27-30) A1 H fStock simulation example A B D E 1 Stock simulation example 2 3 Reorder le 200 lower demand limit 150 4 reorder qui 300 upper demand level 250 5 Lead time 0 6 Day Opening Quantity Quantity stock 7 Demand stock ordered delivered available 8 1 427 0 0 427 227 9 2 200 0 0 200 161 10 3 39 300 300 339 162 11 4 177 300 300 477 164 12 5 313 0 0 313 169 13 6 144 300 300 444 230 14 7 215 0 0 215 206 15 8 9 300 300 309 191 16 9 118 300 300 418 159 17 10 259 0 0 259 185 18 19 20 Number of days 0 21 Mean closing stock 155 22 Number of orders 5 23 Number of back 0 24 & Sheet1 Sheet2 Sheet3 Sheet4 Sheet5 Sheet 3/12 Closing stock 200 39 177 313 144 215 9 118 259 74

Step by Step Solution

There are 3 Steps involved in it

1 Expert Approved Answer
Step: 1 Unlock blur-text-image
Question Has Been Solved by an Expert!

Get step-by-step solutions from verified subject matter experts

Step: 2 Unlock
Step: 3 Unlock

Students Have Also Explored These Related General Management Questions!