

Question: 2-66. Discuss the differences in data that would lead you to construct a line chart as opposed to a scatter plot. a. Construct one bar

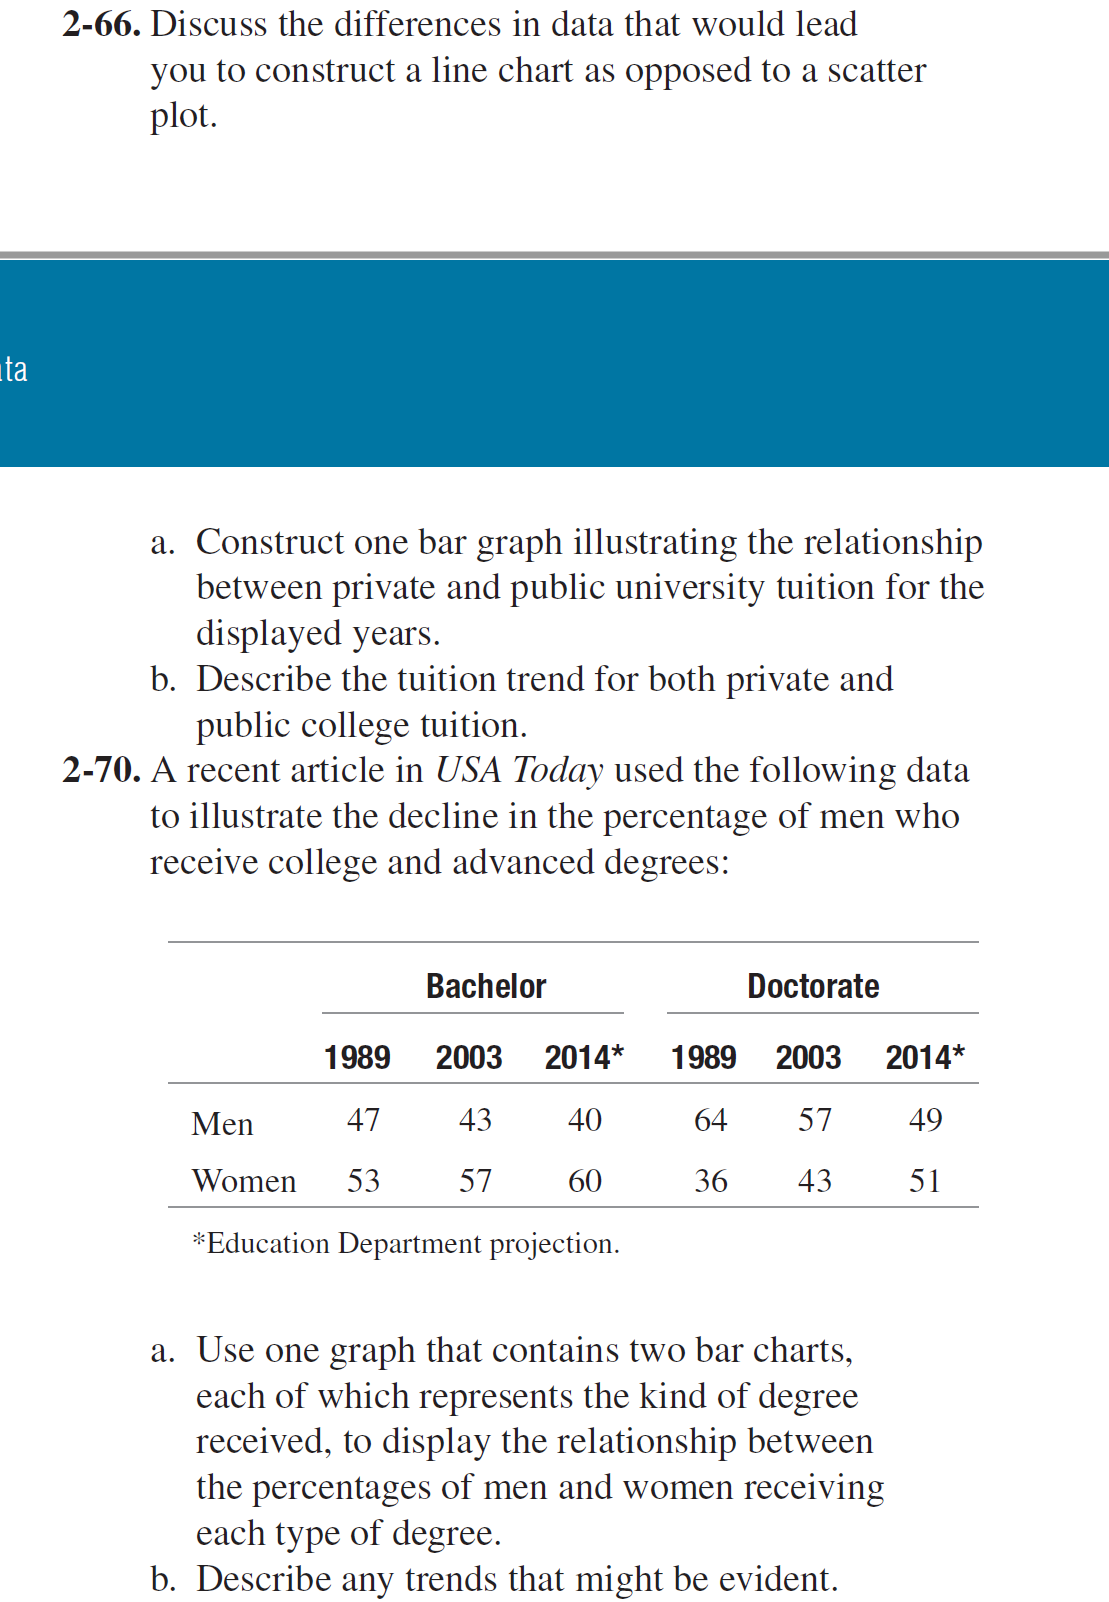
2-66. Discuss the differences in data that would lead you to construct a line chart as opposed to a scatter plot. a. Construct one bar graph illustrating the relationship between private and public university tuition for the displayed years. b. Describe the tuition trend for both private and public college tuition. 2-70. A recent article in USA Today used the following data to illustrate the decline in the percentage of men who receive college and advanced degrees: Bachelor Doctorate 1989 2003 2014* 1989 2003 2014* Men 47 43 40 64 57 49 Women 53 57 60 36 43 5 1 *Education Department projection. a. Use one graph that contains two bar charts, each of which represents the kind of degree received, to display the relationship between the percentages of men and women receiving each type of degree. b. Describe any trends that might be evident
Step by Step Solution
There are 3 Steps involved in it

Get step-by-step solutions from verified subject matter experts