

Question: 275 373 159 86 227 437 285 The data on the table give 311 250 279 215 289 366 179 the weekly amounts 172 232
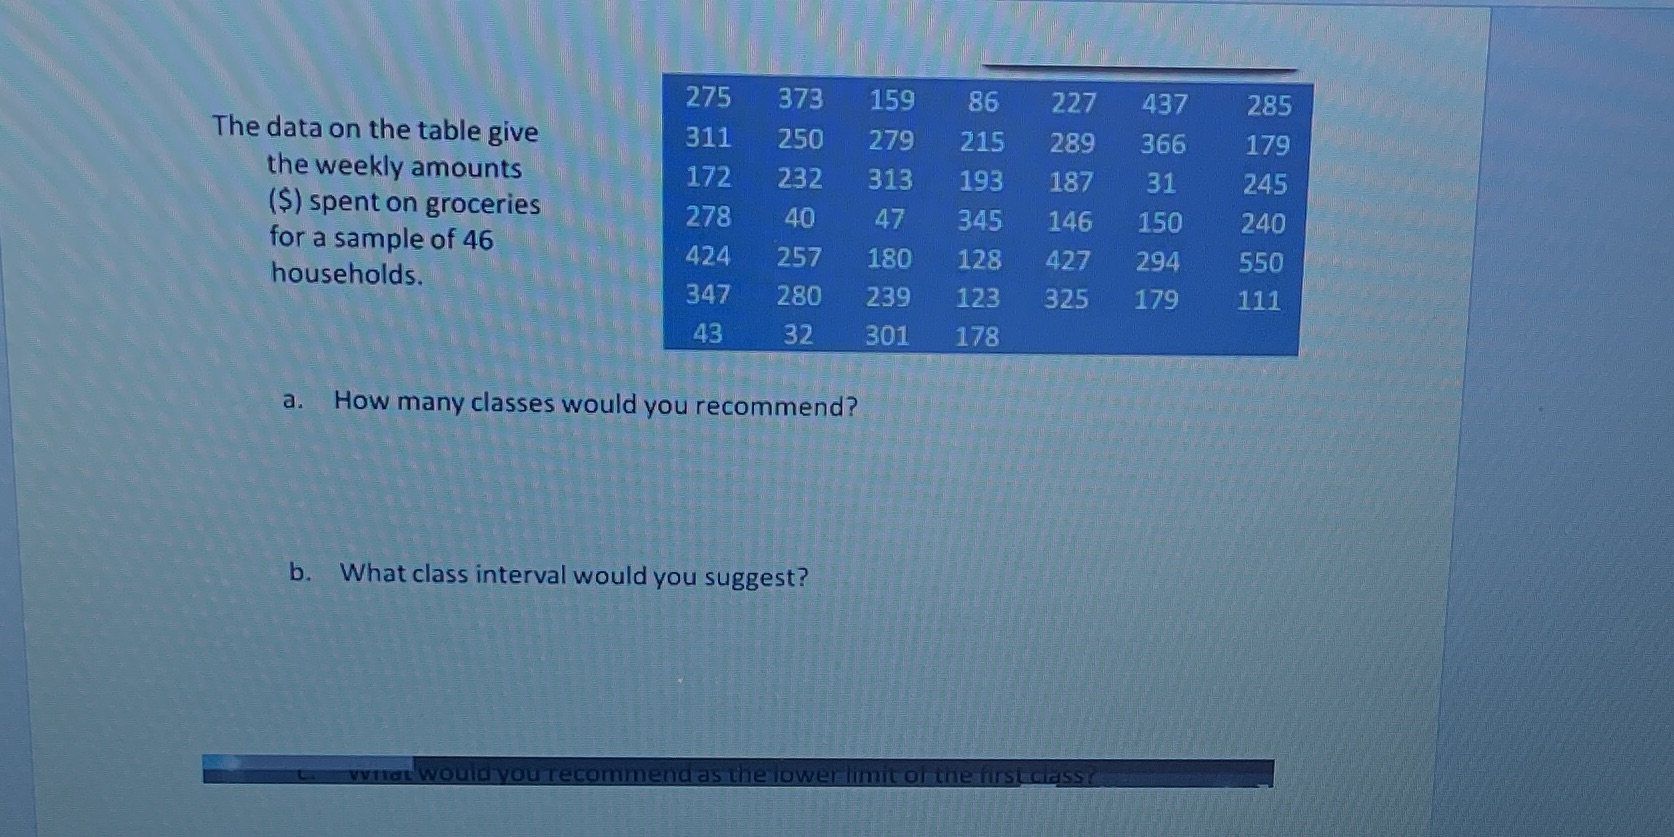
275 373 159 86 227 437 285 The data on the table give 311 250 279 215 289 366 179 the weekly amounts 172 232 313 193 187 31 245 ($) spent on groceries 278 40 47 345 146 150 240 for a sample of 46 424 257 180 128 427 294 550 households. 347 280 239 123 325 179 111 43 32 301 178 a. How many classes would you recommend? b. What class interval would you suggest? vvnot would you recommend as the lower limit of i the first class
Step by Step Solution
There are 3 Steps involved in it
1 Expert Approved Answer
Step: 1 Unlock

Question Has Been Solved by an Expert!
Get step-by-step solutions from verified subject matter experts
Step: 2 Unlock
Step: 3 Unlock