

Question: (28) 1. Consider historical data showing that the average annual rate of return on the S&P 500 portfolio over the past 80 years has averaged
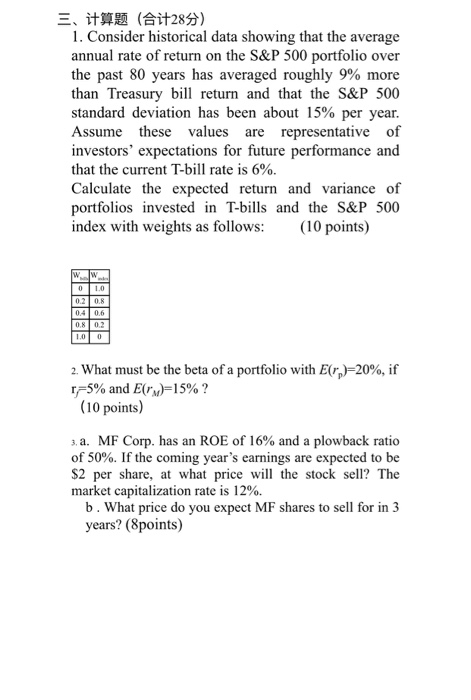
(28) 1. Consider historical data showing that the average annual rate of return on the S&P 500 portfolio over the past 80 years has averaged roughly 9% more than Treasury bill return and that the S&P 500 standard deviation has been about 15% per year. Assume these values are representative of investors' expectations for future performance and that the current T-bill rate is 6% Calculate the expected return and variance of portfolios invested in T-bills and the S&P 500 index with weights as follows: (10 points) Wk 0 LC 0.2 0.8 04 0.6 0.8 0.2 1.0 2. What must be the beta of a portfolio with Er,)20%, if F5% and E)15% ? (10 points) MF Corp. has an ROE of 16% and a plowback ratio of 50%. If the coming year's earnings are expected to be $2 per share, at what price wil the stock sell? The market capitalization rate is 12% b. What price do you expect MF shares to sell for in 3 years? (8points) 3. a
Step by Step Solution
There are 3 Steps involved in it

Get step-by-step solutions from verified subject matter experts