

Question: 29 1 point Three populations all have the same mean of 100 and same standard deviation of 10. They are represented by the following very
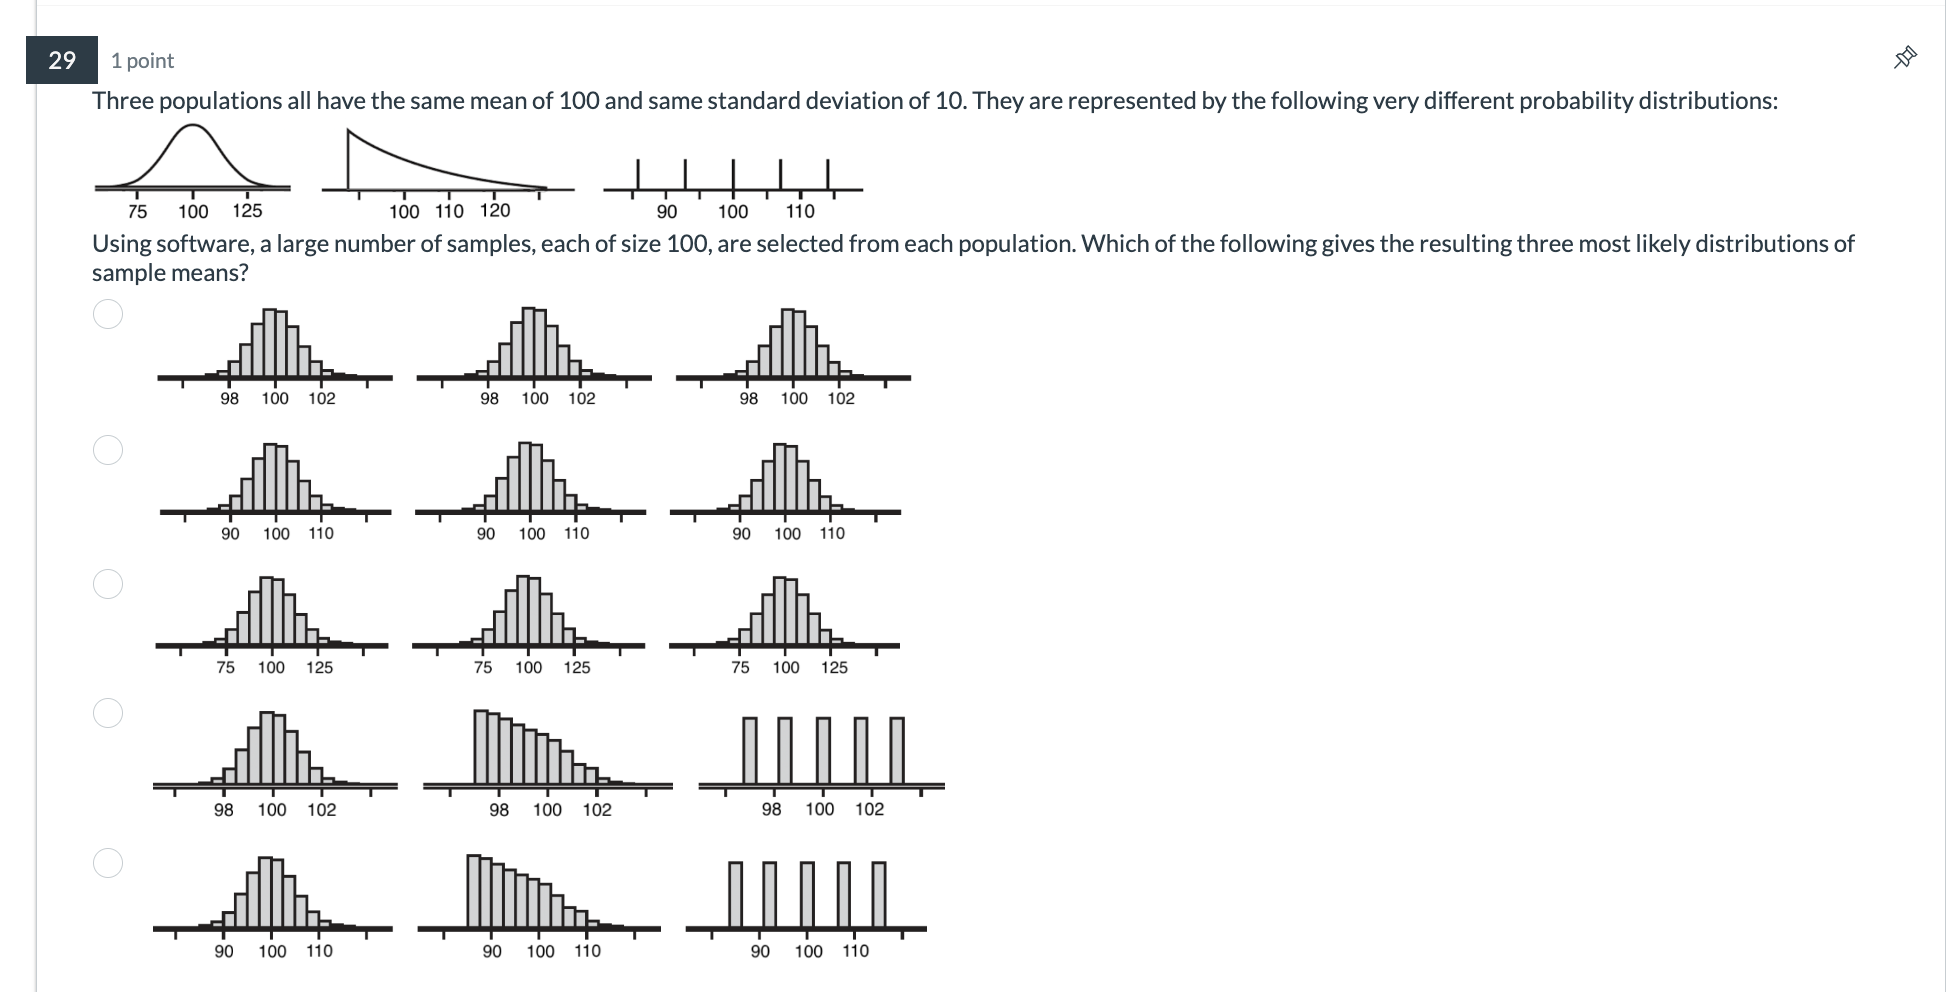
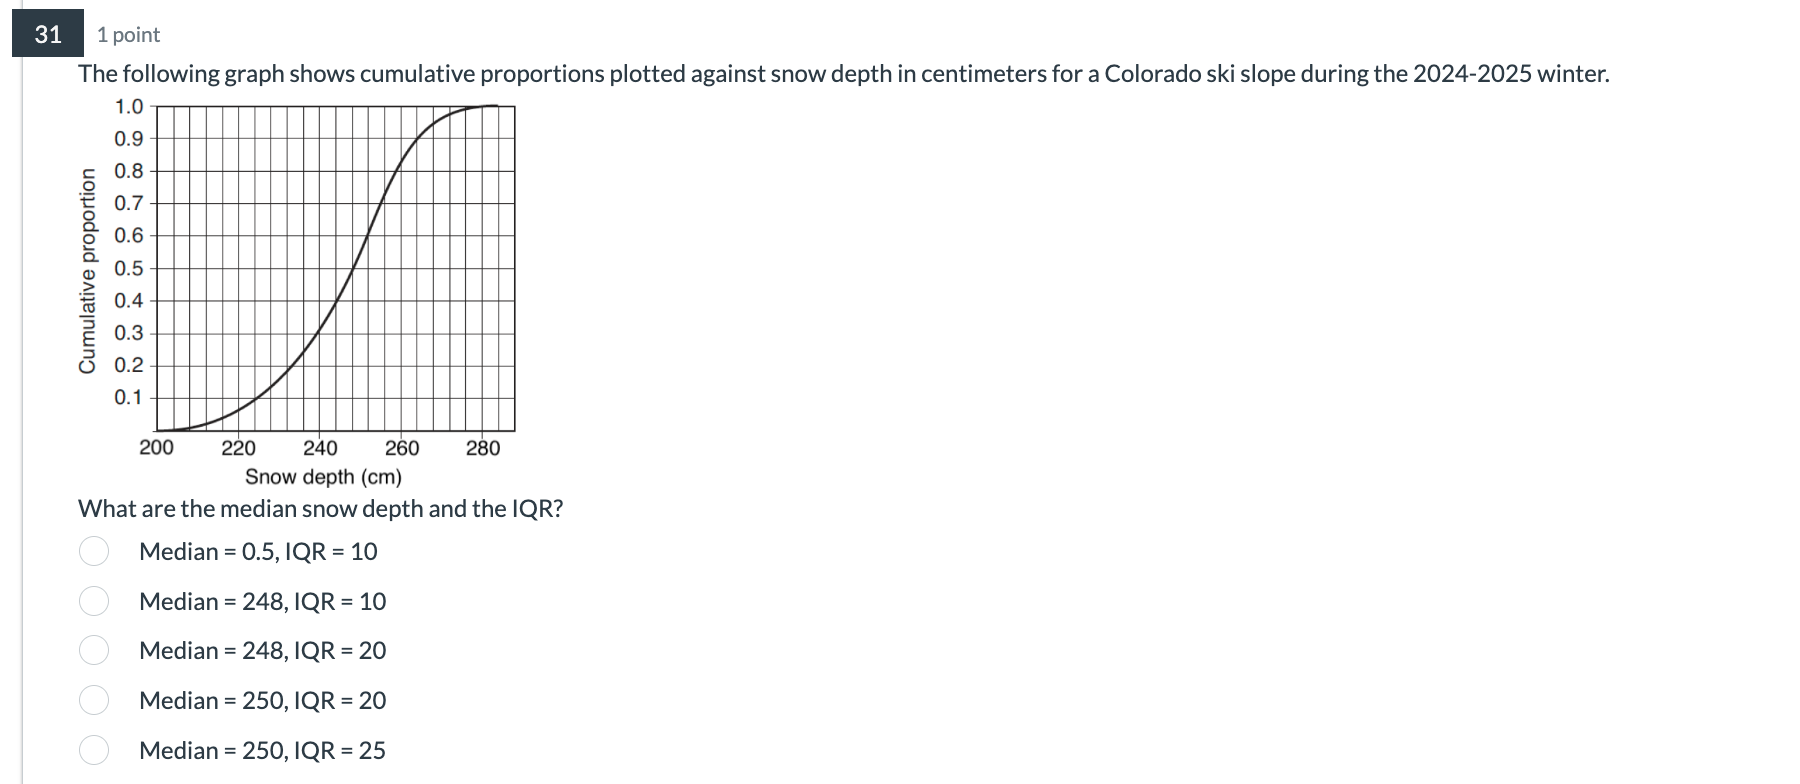
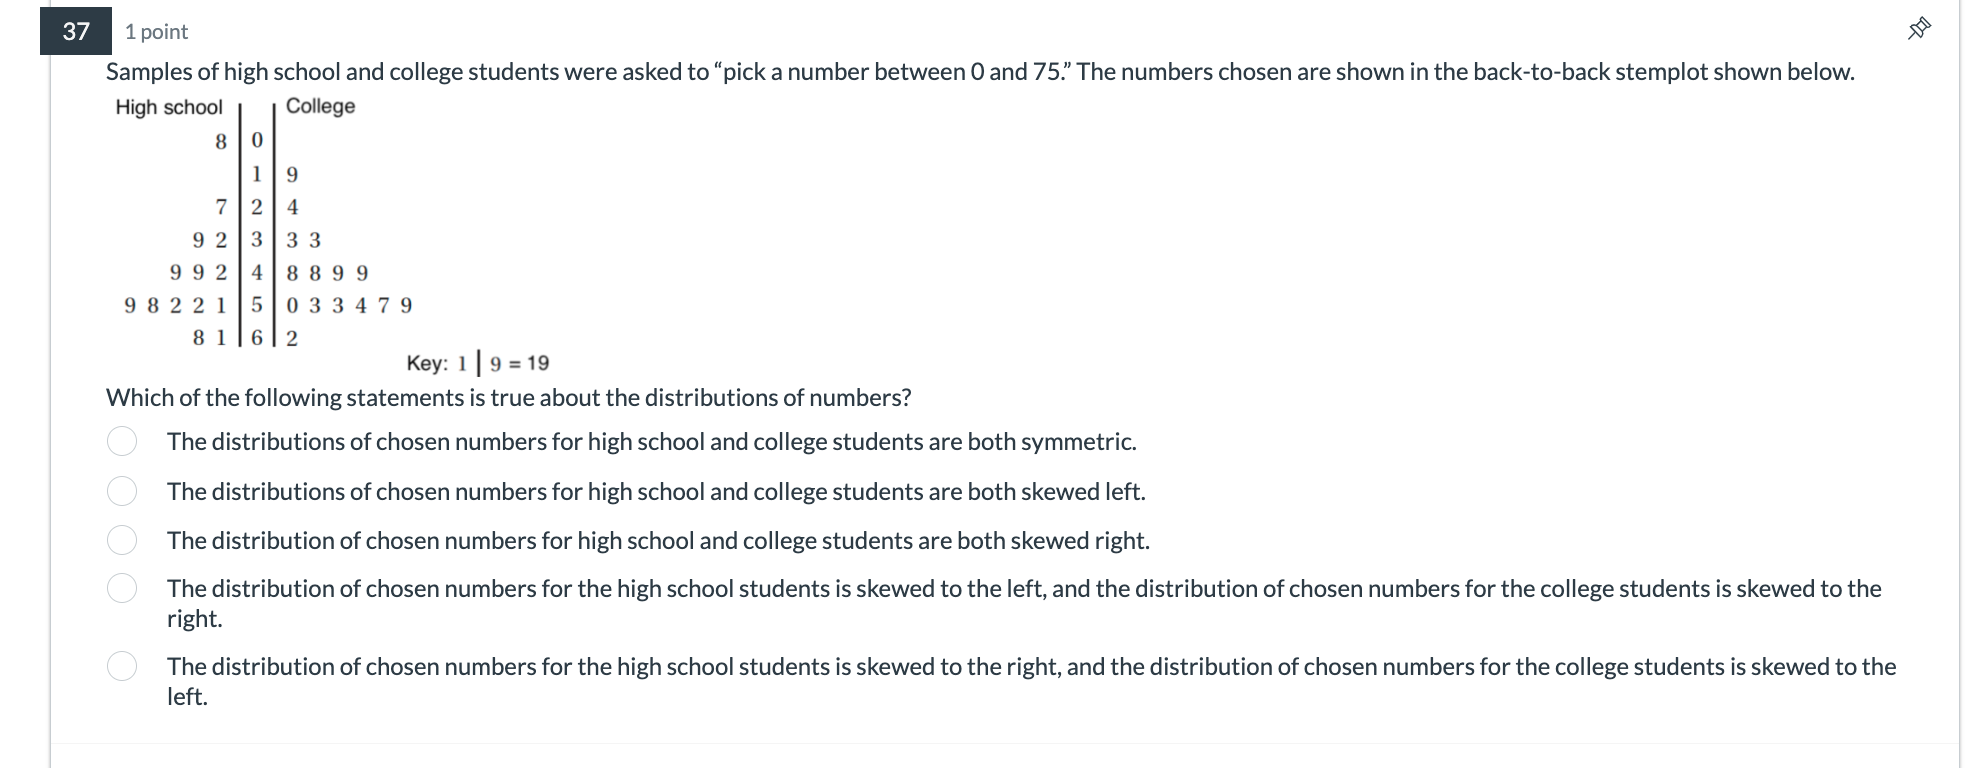
29 1 point Three populations all have the same mean of 100 and same standard deviation of 10. They are represented by the following very different probability distributions: 75 100 125 100 110 120 90 100 110 Using software, a large number of samples, each of size 100, are selected from each population. Which of the following gives the resulting three most likely distributions of sample means? 98 100 102 98 100 102 8 100 102 90 100 110 90 100 110 0 100 110 O 75 100 125 75 100 125 75 100 125 O 98 100 102 98 100 102 98 100 102 O 90 100 110 90 100 11031 1 point The following graph shows cumulative proportions plotted against snow depth in centimeters for a Colorado ski slope during the 2024-2025 winter. 1.0 0.9 0.8 0.7 0.6 Cumulative proportion 988 8 8 200 220 240 260 280 Snow depth (cm) What are the median snow depth and the IQR? O Median = 0.5, IQR = 10 Median = 248, IQR = 10 Median = 248, IQR = 20 O Median = 250, IQR = 20 O Median = 250, IQR = 251 point Samples of high school and college students were asked to \"pick a number between 0 and 75" The numbers chosen are shown in the back-to-back stemplot shown below. High school College g8(0 119 7124 92|3(33 9921418899 98221|5{033479 811612 Key: 1 | 9=19 Which of the following statements is true about the distributions of numbers? The distributions of chosen numbers for high school and college students are both symmetric. The distributions of chosen numbers for high school and college students are both skewed left. The distribution of chosen numbers for high school and college students are both skewed right. The distribution of chosen numbers for the high school students is skewed to the left, and the distribution of chosen numbers for the college students is skewed to the right. The distribution of chosen numbers for the high school students is skewed to the right, and the distribution of chosen numbers for the college students is skewed to the left
Step by Step Solution
There are 3 Steps involved in it

Get step-by-step solutions from verified subject matter experts