

Question: 29. The graph at the right shows the rate, r(t), in hundreds of algae per hour, at which a population of algae is growing,
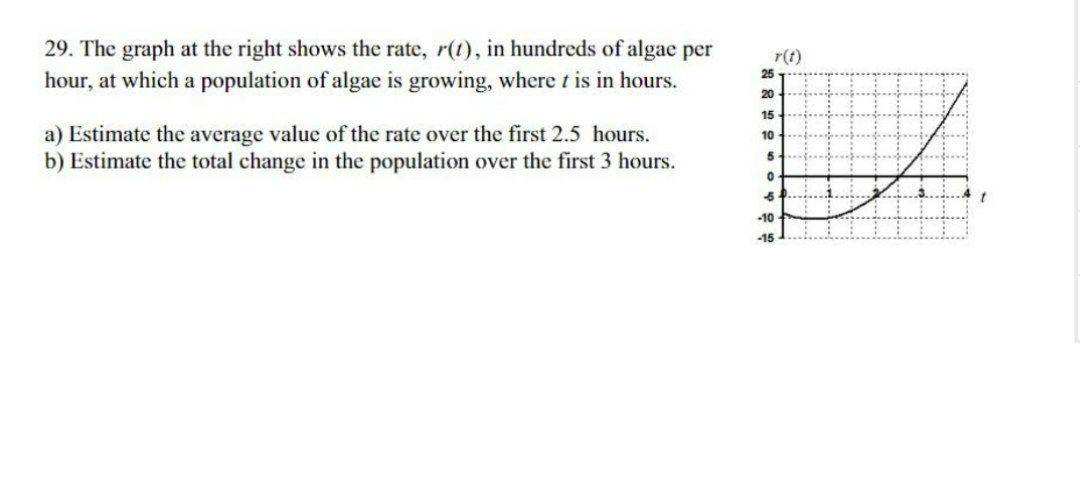
29. The graph at the right shows the rate, r(t), in hundreds of algae per hour, at which a population of algae is growing, where t is in hours. 25 20 15 10 a) Estimate the average value of the rate over the first 2.5 hours. b) Estimate the total change in the population over the first 3 hours. r(t) 5 0 5 -10 -15
Step by Step Solution
★★★★★
3.48 Rating (165 Votes )
There are 3 Steps involved in it
1 Expert Approved Answer
Step: 1 Unlock

Q67 average value of rate over first 25 hours 25 vt ot ... View full answer
Question Has Been Solved by an Expert!
Get step-by-step solutions from verified subject matter experts
Step: 2 Unlock
Step: 3 Unlock