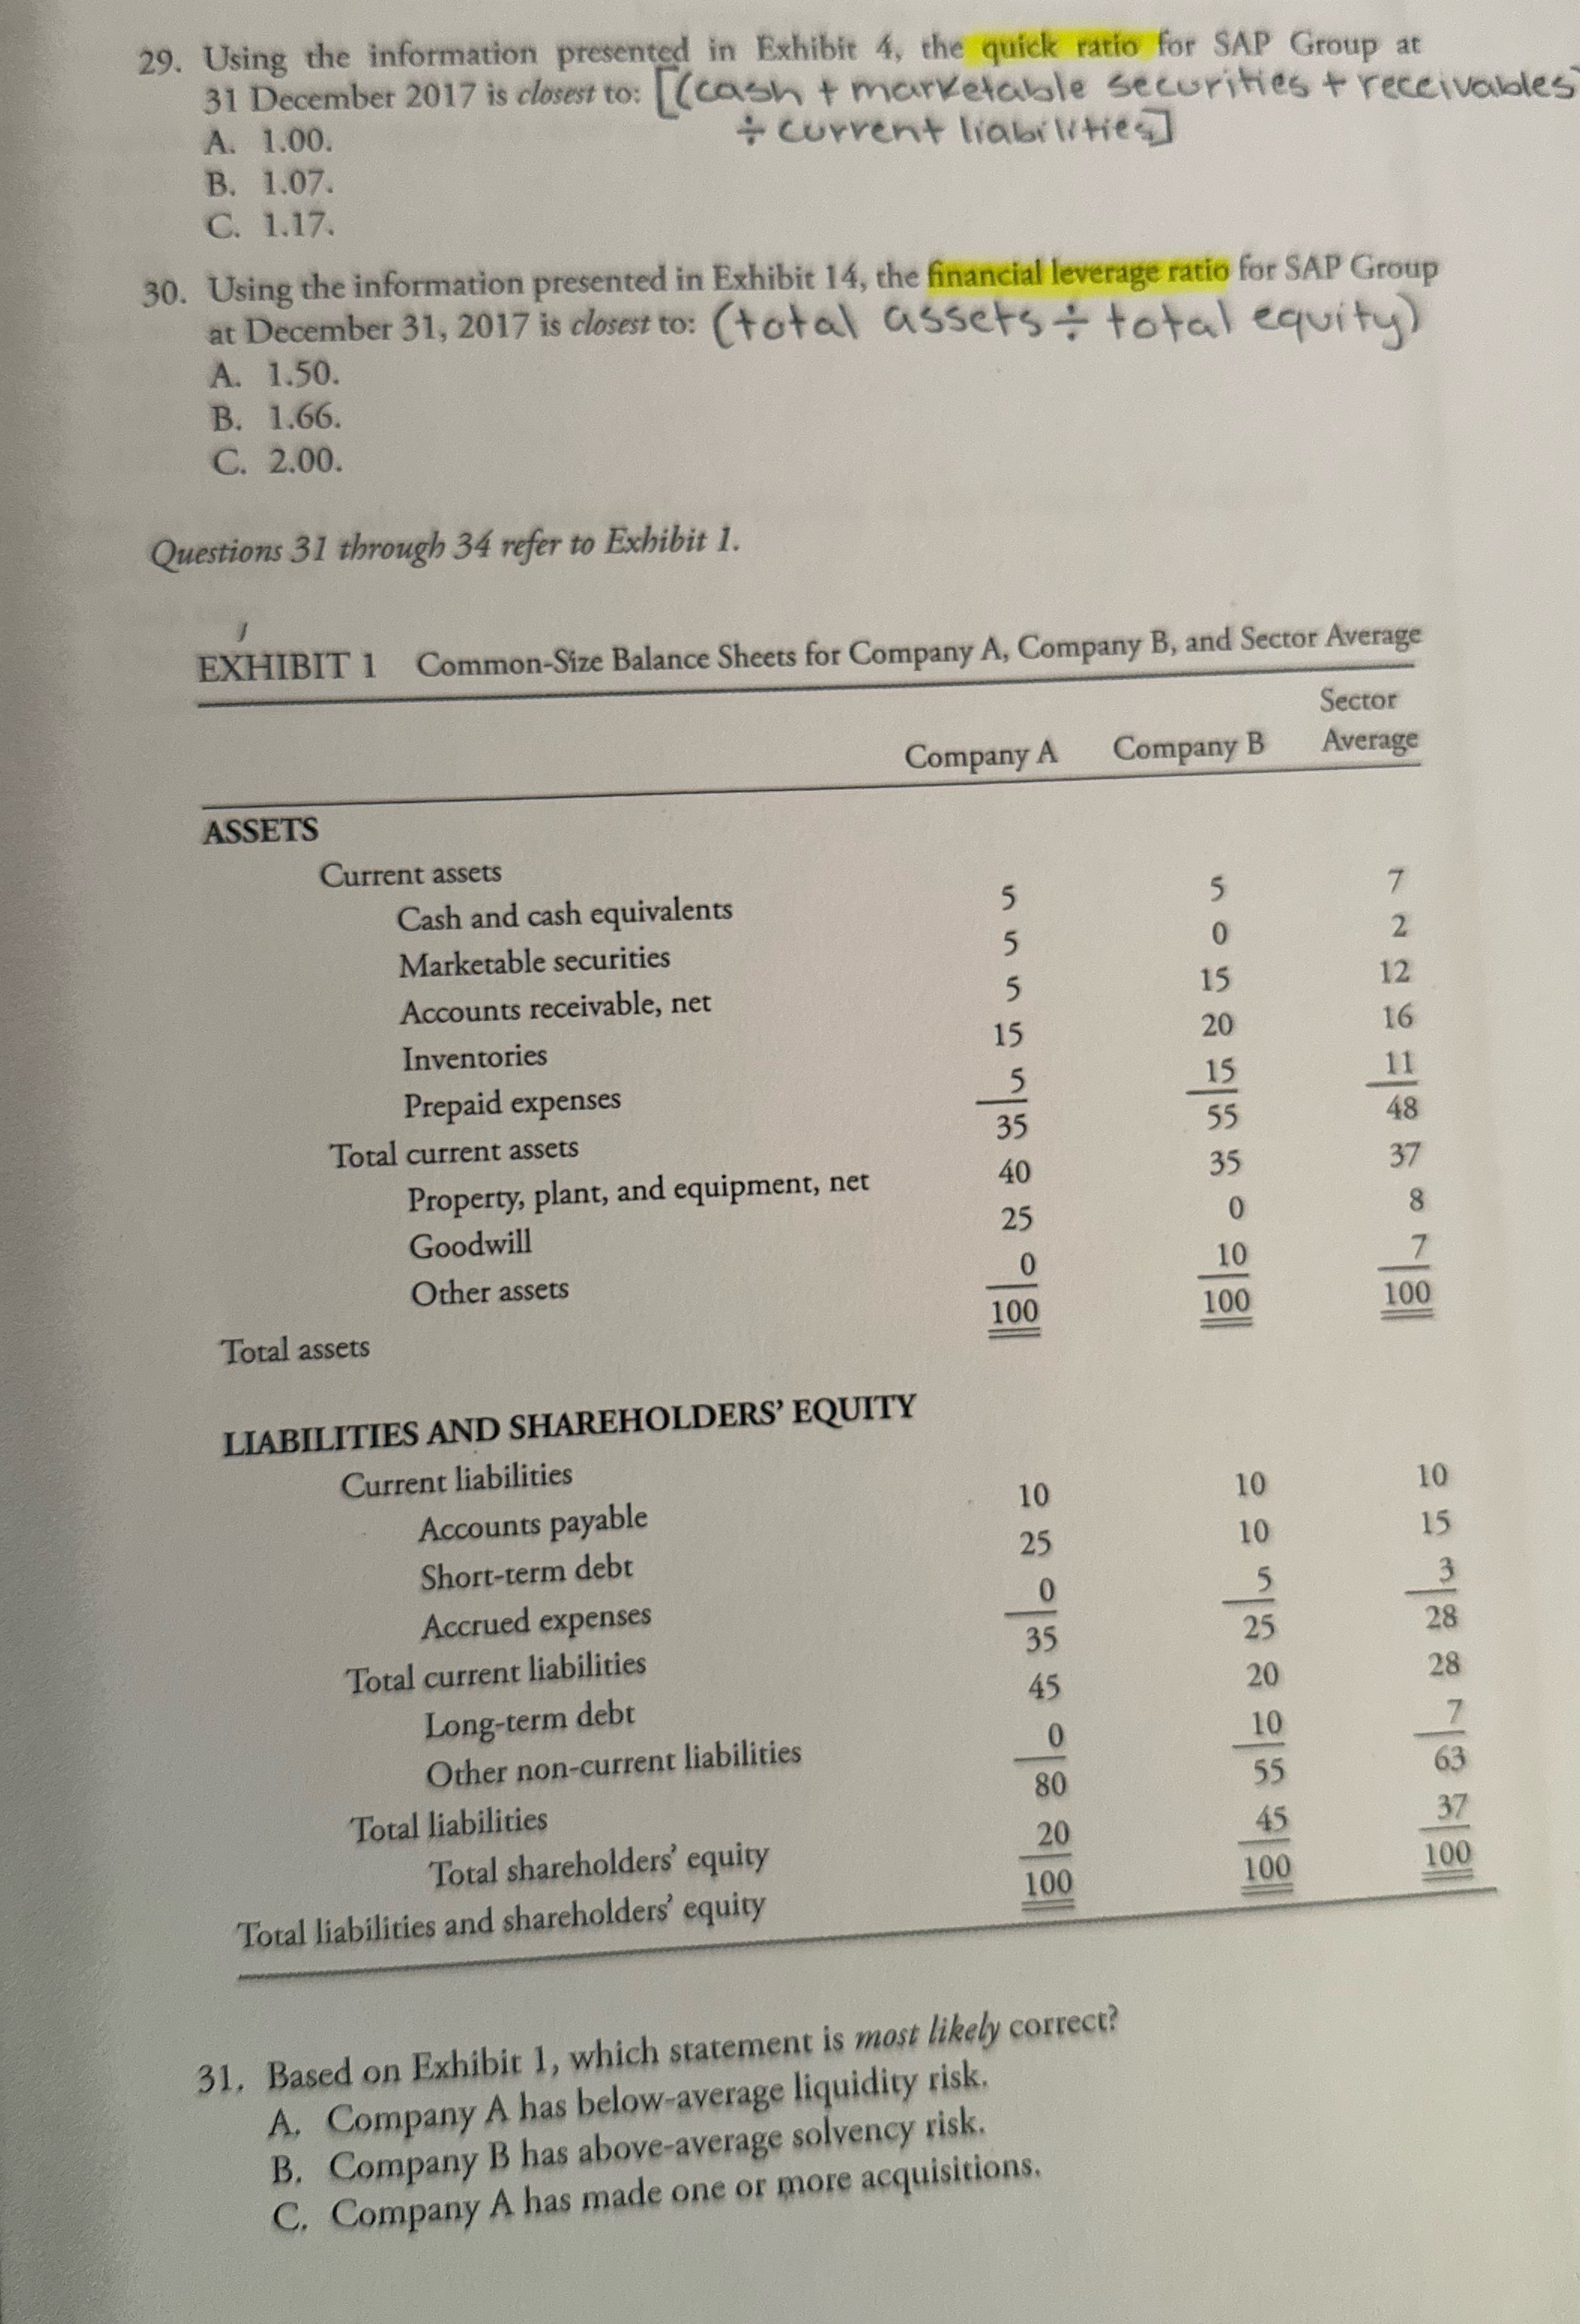
Question: 29. Using the information presented in Exhibit 4, the quick ratio for SAP Group at 31 December 2017 is closest to: (cash + marketable securities

29. Using the information presented in Exhibit 4,
29. Using the information presented in Exhibit 4, the quick ratio for SAP Group at 31 December 2017 is closest to: (cash + marketable securities + receivables A. 1.00. + current liabilities] B. 1.07. C. 1.17. 30. Using the information presented in Exhibit 14, the financial leverage ratio for SAP Group at December 31, 2017 is closest to: ( total assets : total equity) A. 1.50. B. 1.66. C. 2.00. Questions 31 through 34 refer to Exhibit 1. EXHIBIT 1 Common-Size Balance Sheets for Company A, Company B, and Sector Average Sector Company A Company B Average ASSETS Current assets Cash and cash equivalents Marketable securities Accounts receivable, net 12 Inventories Prepaid expenses Total current assets Property, plant, and equipment, net Goodwill 25 Other assets Total assets 100 LIABILITIES AND SHAREHOLDERS' EQUITY Current liabilities Accounts payable 10 Short-term debt 25 Accrued expenses 0 Total current liabilities Long-term debt Other non-current liabilities 0 Total liabilities 80 Total shareholders' equity 20 Total liabilities and shareholders' equity 100 31, Based on Exhibit 1, which statement is most likely correct? A, Company A has below-average liquidity risk. B. Company B has above-average solvency risk. C. Company A has made one or more acquisitions

Step by Step Solution

There are 3 Steps involved in it

1 Expert Approved Answer
Step: 1 Unlock blur-text-image
Question Has Been Solved by an Expert!

Get step-by-step solutions from verified subject matter experts

Step: 2 Unlock
Step: 3 Unlock

Students Have Also Explored These Related Finance Questions!